Hinduja Leyland Finance – A small History

Introduction – Hinduja Leyland Finance (HLF) is majority-owned (92.4%) by the Hinduja group entities. Through Ashok Leyland (ALL) they hold 61.8% of HLF. If one is interested in ALL it is imperative to study the status of their main subsidiary HLF. ALL’s vehicles form 36.4% of HLF’s loan book as of Q2FY20.

Within HLF there is another company as well which focuses on housing finance.

Everstone invested in HLF sometime in 2013, since then HLF tried to come with an IPO twice, once in 2016 but them DEMON happened and the company cancelled IPO plans in mid-2017. The company filed for a DRHP again in mid-2018, roadshows were started as well but after the DHFL fiasco (probably IL&FS as well) the management decided to cancel the IPO plans again due to limited interest from investors.

As usual, I will post a chart repository at the end for you to get a better view of the charts.

REV PAT

P&L

Chart 1 – Both topline and bottomline have witnessed decent growth over the years.

HLF ABS

Absolute Figures

Chart 2 – Depicts branches, disbursements, loan book and net worth.

Most of the branch network is set up in the ALL showrooms, which results in easier customer acquisition.

Both disbursement and loan book has clocked decent growth supported by healthy shareholder’s equity.

LBS

Loan Book Segmentation

Chart 3 – As of Q2FY20 the loan book comprised of 11% in LAP, 77% in vehicle finance. The company used to deploy some capital in the structures assets as well which were 7% of the loan book in FY16. New commercial vehicles form 50% of the book, 2+3W form 16. As of FY19, used commercial vehicles formed 10% of the book, and construction equipment finance 11%. Semi-urban and rural geographies formed 60% of the loan book while the share of first-time buyers was 44% in FY19.

underwriting
Underwriting

Chart 4 – As I have said before, growing the balance sheet and P&L is easy in the lending business, surviving is not. The company is suffering from elevated GNPA and NNPA levels. Some of the increases are attributed to the management moving from 180+ DPD recognition norm to 90+ DPD. It should be noted that the management adopted the stricter NPA recognition norms well before the deadlines mandated by the regulator.

Write-offs and credit costs are also an issue, even after repossession of the collateral. Improvement in underwriting is warranted, though I must say they are doing better than Shriram Transport Finance Corporation (STFC) in NPAs currently.

NNPA PCR

Underwriting

Chart 5 – Provision Coverage Ratios are rising which is a must, a new metric here, NNPA/Net Worth is worrisome though declining. If all of the NNPAs are written off we would wipe out a substantial part of the company’s net worth.

GNPA Seg

Segmented GNPA

Chart 6 – Segmented GNPA %. LAP book has not been seasoned and thus witnessing lower GNPA. Vehicle portfolio is the main cause of the elevated consolidated GNPA.

efficiency

Efficiency Metrics

Chart 7 – Company is maintaining healthy Capital Adequacy, NIMs have reduced over the years. I do not have the data but it is due to either higher cost of funds or lower book yield. ROA and ROE have declined somewhat due to higher credit costs. OPEX is in check.

Fa LEV

Leverage

Chart 8 – Company has increased leverage over the years but has maintained it around 7.5x.

Cap Source

Capital Sources

Chart 9 – A majority of the capital is sourced from banks, quite a substantial amount is sold down as well.

Peer Analysis

Loan Book Peer

Loan Book Peer

Chart 10 – In terms of scale STFC is biggest here followed by Chola.

LBS Chola

Chola LBS

Chart 11 – Chola’s loan book is dominated by vehicle financing which forms 70+% of the book while the rest is home loans.

LBS STFC

STFC LBS

Chart 12 – STFC’s loan book is also dominated by vehicle finance however we have more segmented data available. Heavy CVs form 45% of the book, Medium and Light CVs form another 23% and passenger vehicles form another 22%. They also do a bit of tractor finance, business and working capital loans.

Disbursement PEer

Disbursements Peer

Chart 13 – In terms of disbursement Chola is almost 2x of HLF.

GNPA Peer

GNPA Peer

chart 14 – This is where the underwriting practices of the different managements are tested, STFC clearly has some issues, especially on such a large seasoned book. HLF, while it is doing better than STFC, also has elevated GNPAs especially on a book that is smallest of the lot. Chola is the star here with contained GNPAs on large book size.

NNPA Peer

NNPA Peer

Chart 15 – Again similar story continues as above, CV financing is not bulletproof even though it is secured, it is affected by the cyclicality in the logistics business. The management of one of the companies in a recent conference call did say that our NPAs move with the cycle, in tough times the borrower’s cash flow is stressed but the cycles do not last for long and once business picks up the borrowers get current with the payments.

PCR Peer

PCR Peer

Chart 16 – The provisions coverage ratio of all the company’s is in sub-40 range. This is probably due to the secured nature of lending and lower LTVs. However, it would not hurt anyone to see some higher PCR and reduce those NNPAs further. It will reflect a truer P&L.

NIMs Peer

NIMs Peer

Chart 17 – NIMs used to highest for Chola in the past however they are at par now with STFC. HLF’s lower NIMs means either they are having trouble sourcing cheaper funding or they have to price their loans lower to compete with the biggies. I would have loved to compare the cost of funds and book yields of these companies but I do not have that data yet.

ROA Peer

ROA Peer

Chart 18 – In terms of ROA, HLF has a lot of catching up to do, while Chola and STFC were neck-to-neck in  FY19.

ROE Peer

ROE Peer

Chart 19 – Chola is the winner here with superior ROEs.

Equity Peer

Equity Peer

Chart 20 – STFC is a behemoth in terms of the net worth it has collected over the years.

PAT Peer

PAT Peer

Chart 21 – The size of the loan book directly affects the profits of the company.

branches peer

Branches Peer

Chart 22 – This is an amazing chart to cap off the analysis. Chola is giving some stiff competition with the least amount of branches. While HLF has expanded its branch network well before its loan book is grown.

It would have been fun to see more comparisons in terms of business per branch or employees but pairing the superior ROEs of Chola with its smallest branch network shows that it is indeed the most efficient player with superior underwriting skills. However, it too is not immune to the business cycles of the industry it lends to.

Sources:

  1. Annual Reports
  2. Credit Rating Reports
  3. Investor Presentations

Chart Repository:

https://drive.google.com/open?id=14G2q9Eo771rw7EpfRWUCefuHs1IBAPru

Standard

SBI Cards & Payment Services – Charting through History

Let us discuss some metrics of the newest IPO in town. As the heading of this post suggests, we are going to do this through lots and lots of charts. WordPress has a bad habit of compressing images beyond recognition. I will share a repository of all the chart in full resolution at the end of the post. You can download that and read the blog side by side to make sense of it all.

% cards

Cards in Force (CIF) Segmentation

Chart 1 – Percentage of total cards in force (CIF) sourced from SBI parent is increasing while the premium portion of customers is decreasing. Mining SBI customers for card issuance is neither good or bad. Other issuers are dependant on their parent banks for the same, just that they haven’t carved out the cards business into a separate entity.

% customers

Customer Profile

Chart 2 – Percentage of new customers sourced from the parent has increased significantly. We will have a deeper look into this opportunity in the next chart. Segmentation between salaried and self-employed are mostly stable. With the amount of data available with Credit Bureaus today, the self-employed segment is not as risky as it used to be. Pair that with the spending behaviour data from the parent and one should be able to underwrite their loan book fairly safely.

As for geographical segmentation, in the past few years, more of the new accounts are sourced from non-metro cities. These new customers will not necessarily be of the same spending capacity as those in the metros, which should reduce the per card metrics in the coming years.

Percentage contribution of new to credit customers in new customer acquisitions is increasing. For these new to credit customers with little or no credit history, strong underwriting risk management needs to be maintained with smaller credit limits. We should track this with average credit limit per card, any aggressive growth in this parameter should be tracked closely.

CC per DC

CC/DC

Chart 3 – Depicts the ratio between the issuers Credit Card (CC) and Debit Cards (DC). RBL is the new outlier here building its CC base before its DC base. Ignoring RBL and comparing to the other top competitors, there are good arguments to be made that SBI Cards can tap into the SBI banks customer base to improve their CC base for a good amount of time. Industry average being low single digits signifies that other smaller card issuers are skewing the averages.

That being said, the customer profile of SBI and other top private banks will be very different and if SBI’s customer base is skewed towards the elderly, retired or lower-income customers, the utility to tapping parent customer base will dwindle significantly.

I will discuss more industry dynamics at the end of the post.

% receivable

Receivable

Chart 4 – Depicts the % of receivables from EMI loans, revolving credit and transaction-related fees. The yield on revolving loans is the highest, as a shareholder one can cheer for this metric to rise, but as a fellow human one should never wish for another human to fall into this trap of compounding interest.

active cards

Active Cards

Chart 5 – Percentage of CIF that were used at least once in the past 30, 90 days. Comparison with competitors is necessary to form a baseline.

abs revseg

ABS Rev Seg

Chart 6 – Breakup of revenue streams from different segments. Majority of income coming from interest earned and fees. In interest income, the majority of it is coming from revolving loans. In my view, this is not sustainable in the long term. Customers are paying exorbitant interest rates on these revolved loans, and they will eventually either default or clear them but once bitten they will not extend the loan on CC. Yes, this metric can continue growing till they keep finding new customers who don’t know painful the interest payments revolving loans are, but what damage does it do the long term relationship with the customer.

Another risk is the regulator limiting the interest rate on these loans when CC penetration reaches high levels and enough people are affected by these. It is better to build an EMI book and fee-based income stream than the revolving loan book.

In fee-based income, the fee is earned from annual card charges and transaction-based fee. The more the customers will swipe their card the better it is for the company.

AUM Yield

Book Yield

Chart 7 – Book yield has been maintained in the past, not entirely sure of the cause for the recent increase in FY19. Will have to monitor whether this is sustainable.

avg loan pe cc

Average Loan per Card

Chart 8 – Depicts the average loan outstanding per card for the top issuers in India.

avg spend per cc

Average Spend per Card

Chart 9 – Average annual spend per card for the top issuers in India. Citi seems to have a good chunk of prime spending customers.

avg spend per txn

Average Spend per Transaction

Chart 10 – Average spend per transaction for the top issuers in India. Citi’s customers being the biggest annual spenders but with smallest transactions size means they must be having the highest absolute transactions as well, and that means more fees for Citi.

BVPS

BVPS

Chart 11 – Book value per share for SBI Cards. Need to monitor whether the growth continues at this trajectory.

capital sources

Capital Sources

Chart 12 – Depicts sources of capital. Majority of which is coming from loans from banks.

CAR

CAR

Chart 13 – Capital Adequacy ratio is well maintained.

CC CIF MS

CIF MS

Chart 14 – Represents the market share of top issuers on the basis of CC-CIF. HDFC is in the lead.

CIF Growth

CIF Growth

Chart 15 – A longer history of CC-CIF for SBI. This should give an idea of what a complete business cycle can look like. I wish I had an even longer history of this chart to show what lead to the degrowth in the crisis years.

CIF

CC CIF

Chart 16 – Depicts the CC-CIF in absolute numbers. 3x growth for SBI in 5 years can be a cause for concern. However, even the leader HDFC has grown 2.5x in the same period.

Cost of Funds

Cost of Funds

Chart 17 – Recent rise in the cost of funds needs to be monitored. Could be a one-off due to ILFS crisis.

Cost to Income

CI

Chart 18 – Cost to income ratio is stabilising around 60%. Wish we had standalone data from competitors to form a baseline. Any further reduction is welcome.

Credit Cost %

Credit Cost %

Chart 19 – Credit Cost % from a research report, they, however, provide no explanation of the calculation of this metric. The provisioning metric that I discuss later on is I believe the true credit cost for this business.

debt

Debt

Chart 20 – Borrowings have grown with the loan book expansion.

Employee exp

Employee Exp.

Chart 21 – Employee expenses have ballooned recently.

employee

Employees

Chart 22 – Number of employees. Pair this with chart 21 above and something seems off. 4x growth in employee expenses with only 21% growth in the employee base. Either these new employees are very well paid or their compensation matrix across the whole organization was reworked before the IPO or they have increased temporary staffing for sales who are not enrolled with the company.

GNPA %

GNPA %

Chart 23 – GNPA % figures. Look at the FY08 tower of GNPA. Lending business runs well with management’s prime focus on underwriting. Without it, the entire shareholder’s equity will be wiped out. Whether this will happen again is difficult to determine unless we go in-depth into the history of the events that lead to this. What management incentives lead to such a disaster in the past is the question here.

gnpa

GNPA

Chart 24 – GNPA in absolute terms.

income per cc

Income per Card

Chart 25 – Annual income per CIF. A mix of interest and fee-based income.

int exp

Int. Exp.

Chart 26 – Interest expense for SBI.

lbs

Loan Book Segmentation

Chart 27 –  Loan book segmentation. Obviously, the majority of the loan book is unsecured. Would be good to see the contribution of corporates increase as they are big spenders.

loan book growth

Loan Book Growth

Chart 28 – Loan book growth has been high for quite some time now. Ghosts of previous business cycle growth eventually show up if underwriting is not maintained.

loan book

Loan Book

Chart 29 – Loan book in absolute terms.

misc exp

Misc. Exp.

Chart 30 – Misc. expenses over the years. Sales and promotion expense has increased 5x in 4 years. Will this be a constant expense to acquire more customers or will it end with the IPO listing? If it continues this will lead to some serious CAC (Customer Acquisition Cost). The company acquired some 20 lac cards in FY19, and thus they spent Rs. 8178 per card in just promotions, offers in a bid to acquire the customer. Other costs are yet to be expensed and their income per card in FY19 was Rs. 10,030. Will have to dig further into their CAC to determine from which year is the customer relationship profitable for the company.

misc. exp. as a % of revenue

% Misc. Exp.

Chart 31 – Misc. expenses as a percentage of revenue. See that royalty figure, we will discuss that at the end.

net worth

Net Worth

Chart 32 – Net worth over the years. Impressive growth, but I must also point out that in FY13 & 14 the retained earnings of the company were negative probably due to the losses in the loan book from the previous business cycle. Net worth was positive in those years due to equity capital infusion.

NII Growth

NII Growth

Chart 33 – Net Interest Income growth.

nii

NII

Chart 34 – Net Interest Income in absolute terms.

NIMs

NIMs

Chart 35 – Net Interest Margins have improved with improving loan book yield.

NNPA %

NNPA %

Chart 36 – NNPA % has been contained at sub 1% since the entry of Carlyle.

nnpa

NNPA

Chart 37 – NNPA in absolute terms.

Online card spends

Online

Chart 38 – Depicts the percentage of transactions for online purchase. Seems like their sales, offers and promotions for online purchases could be a good reason that could attract customers to SBI.

other income

Other Income

Chart 39 – Other income in absolute terms.

pat

PAT

Chart 40 – PAT in absolute terms. The lending business is tail-ended which means the lender makes their actual profits when the last few instalments are paid. Half of the company’s revenue is from interest income and thus a portion of this PAT cannot be relied upon completely until we can ascertain the quality of underwriting of the management.

PCR

PCR

Chart 41 – Provision Coverage Ratio. Good to see PCR increasing with the entry of Carlyle.

ppop

PPOP

Chart 42 – Pre-Provisioning Profit in absolute terms.

Provisions as a % of assets

% Provisions

Chart 43 – Provisions as a % of average assets. With reference to Chart 19, I believe that these are the true credit cost on the loan book of the company. These are awfully high and are a result of the unsecured nature of the loan book. Will seek confirmation from the management.

provisions

Provisions

Chart 44 – Provision Expenses in absolute terms.

rev seg

Rev. Seg.

Chart 45 – Depicts the revenue segmentation. Half of the revenue comes from interest and the other half from fee-based income. Amongst fee-based income, half comes from the interchange fee, one third from instance fee and the rest from annual subscription charge.

reward as a % of spend

Rewards Spend

Chart 46 – Reward redemption expenses as a percentage of total spend on the card. RBL is clearly trying to lure customers with rewards. SBI is being competitive by offering higher rewards than competitors.

rewards per cc

Rewards CC

Chart 47 – Rewards expense per card in absolute terms. Same story as above.

ROA

ROA

Chart 48 – Return of Assets (ROA) has been maintained throughout. AMEX’s figures are for India business and are surprising. Industry benchmark ROA is 3.5%.

ROE

ROE

Chart 49 – Return on Equity (ROE) is stable over the years.

single borrower exposure

Single Borrower Exposure

Chart 50 – Concentration in single borrower appearing in cards business is very surprising. Have discussed more about this at the end.

total spend ms

Total Spend MS

Chart 51 – Market share based on total spend. HDFC dominating again.

total spend

Total Spend

Chart 52 – Total annual spend for the top card issuers. Growth is systemic.

transaction MS

TXN MS

Chart 53 – Market share based on transactions. SBI slowly inching up, HDFC and Citi declining.

txn

Transactions

Chart 54 – Number of transactions for the top issuers. Growth is systemic.

ALM

ALM

Chart 55 – Asset Liability Management (ALM) is not a concern since CC as a product has a maximum of 50 days as the interest-free period. Transactions which are converted to EMIs are also short term and are mostly paid off within 2 years. Such short tenures can be easily matched with short term capital sources.

Industry Dynamics

One can pair Chart 3 with CC penetration metrics in India, EMs and DMs to paint a story of structural growth. However, we need to account for the following developments as well, in China, the average spends per capita per year via CC was $2000 a few years back and has dropped to $1300. In the USA it is $ 3000. In India, it is already $ 2000. Comparing the spends it seems like the card issuers have captured the premium market till now, this metric will go down if we grow by acquiring more mass-market customers.

First China regulated the market by not allowing MasterCard, VISA to enter the market. Then Alibaba disrupted the market with QR payments. They are offering credit through QR for anything that you pay for. Alibaba is in India also, Google, FB, were restricted from the Chinese market, will they stay dormant on a market the size of India?

We have 2 contrasting market cases where USA is difficult to disrupt as the CC culture is well entrenched. New forms of payments are not widely or easily adopted there. China, on the other hand, came up with a completely new platform with homegrown companies. India is somewhere in the middle, most of our population is yet to adopt the new techs. The ones who have adopted the old ones have some inertia in changing their platforms.

Whether India will follow the trend of skipping landlines for mobiles in the payments space is the greatest question in the investment thesis for this company? The adoption of UPI is a great case study. India with its young population found it easy to adopt a new platform and the fact that there were no transaction charges helped a lot.

So the risk of disruption from new platforms like wallets, EMI on DC, is real. India is quick to adopt new platforms if they offer convenience and save a few bucks. It is all about which platform the newly acquired customer is introduced to. Just as brands see their power weakening in the age of the internet, as younger generations replace the older ones the inertia for new adoption is much less.

That being said, card issuers are cognizant of the fact that platforms for credit distribution could easily jump from plastic to smartphones and thus are introducing CC that is stored digitally and has tap to pay capabilities. Essentially, what we need to remind ourself of is that the card issuers core business model is that of providing credit, rewards, and interest-free period. Plastic cards are just the platform on which this is facilitated. If the platform shifts to smartphones in the form of wallets or virtual cards the card issuer could change the delivery platform of their business.

The other question to ask is what is so special about providing credit with interest-free period to customers. Anyone with deep enough pockets and regulatory approval can do the same. Money lending by itself is a commodity business after all. Well, this is where banks who are also card issuers have the advantage. They sit on a gold mine of customer data, they can easily, efficiently and cheaply acquire customers. Cards business is just another vertical which is a value add to help deepen the relationship with the customer.

SBI Cards being separate from its parents does have limitations on the data it can use from its parent. The customer data cannot be transferred without their consent is what the management shared in an interview. But with data privacy and protection almost non-existent in India, I am not fully convinced whether SBI cards does or does not have full access to its parent’s customer data.

New entrants without customer data, could be limited to their niches. The wallet operators do have the wallet transaction behaviour but the customer relationships are relatively new, the spends are frequent but small. Whether that is enough to give them the edge in India, as Alibaba witnessed in China is what remains to be seen.

Regulations also play a key role here, the wallet operators have been limited to payments banks here in India. If RBI allows them to become full-fledged banks they could easily give good competition to other payment facilitators.

Key Monitorables:

  1. Growth – With aggressive growth for the IPO, we will need to monitor the steady-state growth rate of the business post-IPO. Growth in Revenue, PPOP, PAT, Loan Book, customers accounts etc. is a must-watch at current valuations.
  2. Underwriting – NPAs, PCR, Credit Costs can easily deteriorate with a fast-growing loan book and lax underwriting norms. Any deterioration in these figures is a cause for concern. Client concentration is another monitorable, I know this doesn’t make sense in a credit card issuer company which has loads of granularity in its loan book but as I have shared in one of the charts above client concentration has already appeared in the loan book. The management has internal controls limiting single borrower exposure to 200 cr and 15% of net worth, and group exposure to 25% of net worth. Both figures are not encouraging.
  3. Customer Profile – Average Spend per Transaction, Average Outstanding per Card, Income per Card, New to Credit, Corporate Cards, active cards/customers, Salaried vs self-employed etc. are a few metrics we can monitor to judge the changing customer profile. A share of premium customers is better as they will spend more, might also have a propensity to let go of rewards due to time constraints.
  4. Efficiency – OPEX, Employee Expense, Promotion Spend, Rewards Expense, Cost to Income, NIMs etc. need to be watched to ensure that the management is not facing stiff competition. In a tough competitive market, these spends would go up to acquire customers. CAC (customer acquisition costs) are real in this industry.
  5. Market Share –  While the management has been charging ahead gaining market share for the past few years, which is easy to do in the lending business, the real test is performing well across a full business cycle without deteriorating the quality of the loan book.
  6. Business Cycle – The last downturn of 2008 was not kind to the company, with the retained earning going negative until FY14.

Red Flags: 

  1. Royalty – The company pays its parent 2% of PAT or 0.22% of revenue, whichever is higher, as royalty. As Mr Kiran D points out in a twitter thread, the parent SBI has a similar royalty structure with its subsidiary SBI Life Insurance, however, there is an annual limit of 30 cr on the royalty payments. No such limit exists here. Why the step-brotherly treatment despite Carlyle being on the board?
  2. “Effective from April 1, 2018, SBIBPMSL, amalgamated into our Company. Our Restated Financial Statements for Fiscal 2018 have been restated as if that merger had occurred on December 15, 2017”. SBIBPMSL was providing back end payment processing and services to SBI Cards. What is interesting is the date of amalgamation. “The Scheme of Amalgamation was approved by the NCLT, Delhi pursuant to its order dated June 4, 2019. The Scheme of Amalgamation became effective on June 14, 2019, which is the date on which it was filed with the RoC.” Share exchange ratio for this entity was quite strange 1:4.04 and 9.5 cr equity shares got added to SBI Cards entity. Of course, the management will call this unit as ‘strategic’ to the company & hence the merger. But this entity is usually like any other 3rd party processor.
  3. The DRHP was filed on Nov 26,2019. However, very strangely, there is this line “Bank Distribution Agreement dated November 20,2019 between SBI and the Company”. I mean, a new agreement just 6 days before DRHP. This is for SBI cards to use some part of SBI branch facilities “Pursuant to the Bank Distribution Agreement, the Company is required to pay a commission to SBI at rates mutually agreed between the Company and SBI.” No percentage rates are given, but hope standard rates will apply. Just very strange that they had to sign on Nov 20 and not earlier.
  4. The spend-based fees (interchange) increased by 40% between H1 2018 (712 cr) to H1 2019 (997 cr). Why such a drastic increase, apart from increase in no. of cards? Well, “total credit card spends and changes in industry-level interchange fee billing arrangements among the payment networks, acquirers & credit card issuers in India, which resulted in a more favourable interchange fee structure”. I can’t find any public info around this. So, a 35% increase in the number of credit cards (not of all which might be active) and a 40% increase in revenue. That’s a pretty steep favourable interchange fee structure. Would be good to probe the mgmt on this when they have their Analyst meets & see on what basis is this so favourable.
  5. Other income bumped up by 161 cr (which works to 120 cr PAT) in FY19. What constituted such huge other income? “primarily due to a revision in our actuarial valuations for reward point redemptions and expiry rates estimates”. Discount by 120 cr PAT as one-time Impairment & bad debt losses moved from 525 cr to 725 cr, a 40% jump. But why? “921.4 million accelerated write-off in H1 FY20 as a result of financial difficulties faced by one of our corporate customers”. Whoa. Back up, back up. What ‘corporate customers’? We thought it was retail.
  6. A 54 cr business development incentive income. And what’s that? “which resulted in us meeting our incentive targets under our business development incentive agreements with the payment networks.” Just to be aware of different levers and one-times and recurring of revenue segment.
  7. On bad debts “3,361.35 million, or 56.2%, increase in bad debts written off resulting from higher credit stress in certain portfolio segments observed in fiscal 2018”. Just the start, do you think?

Chart Repository –

https://drive.google.com/open?id=1c0VSaunykhzl9zzvCW_cKOR56HuIEtyc

Sources:

  1. IPO Document.
  2. Various Research Reports.
  3. Investor Presentations.
  4. https://twitter.com/_kirand/status/1201828124129775622?s=03
Standard

Indian Equity Markets: A Data History

A data history of the Indian equity markets should be an ideal starting point for all who are starting the investing phase of their life. You could be investing, directly, or via an advisor, PMS, AIF, or MF and could be interested in individual equities, thematic, sectoral, strategic, ETF, Index, etc. This data history will give you a benchmark on what kind of returns to expect, what lumpiness the returns could have, the importance of investing only your patient capital into equity products, and why one needs to be careful around periods of market euphoria.

I have covered major indices based on their popularity, history, and while I could certainly add more indices given the time and resources, google sheet has a 5 mn cell limit which quickly got filled with this data. I have thus not included sectoral and thematic indices as comparing them to broad-based indices is pointless. Broad-based indices and their historical returns should be directly comparable to most diversified portfolios. However, I have included two strategy based indices into the comparison, they are the simplest form of factor-based investing.

I have included comparable indices from both NSE and BSE as I wanted to focus on the value-add if any provided towards the indices’ returns by these two major exchanges and whether we could identify a clear loser and winner.

Indices

I have included the following indices in this comparison:

  1. NIFTY 50
  2. SENSEX
  3. NSE 100
  4. BSE 100
  5. NSE 200
  6. BSE 200
  7. NSE 500
  8. BSE 500
  9. NSE MIDCAP
  10. BSE MIDCAP
  11. NSE SMALLCAP
  12. BSE SMALLCAP
  13. NSE MIDSMALLCAP
  14. BSE MIDSMALLCAP
  15. NSE ALPHA 50
  16. BSE MOMENTUM

The data for the above indices is available from different time periods, I could have cleaned the comparable indices data to avoid any outliers which may have crept due to differing market cycle in the longer time periods but I wanted to include the oldest data points I could find. I will call out such outliers in the data and not consider them for comparison.

Indices Dates
Dates

Rolling Returns

To start with let us pick up the rolling return charts of different indices. If you do not know what rolling returns are, what you need to know is that rolling returns are an attempt to protect ourselves from the bias of picking arbitrary starting and ending points in any time data series.

You all must have heard the stories from someone highlighting that XYZ asset class or instrument gave ABC returns between timestamp 1 and 2. What this ignores is that we have no idea what the returns were between or outside these timestamps. This technique is used by both bear and bull camps to reinforce their bias or view.

So instead we look at rolling returns on a daily price data where we calculate returns from a date “t” to date “t+250” and then we take “t+1” and “t+251” for the next rolling period and so on until the end of the dataset.

As humans, it is impossible to completely remove our biases, and in the rolling return charts below I have included my human bias of choosing arbitrary time periods of 1 month, 1, 3, 5, 7 and 10 year periods. This is a civilization/planet-based bias that we all have. Suppose if we were on a different planet in our or different solar system (hopefully in the goldilocks zone), or  Earth took a different time period to revolve around the Sun we would be using different time periods to measure performance (same goes for measuring company/investment performance on a quarterly or financial year basis. Do not dismay if a company does not perform in these arbitrary time periods, each company’s business model is different and it takes different time periods for each one to grow their dominance. However, for now, we are stuck with the time period our civilization uses.

I have assumed approximately 250 trading days in a year. The monthly and 1-year return figures are absolute, while the longer timeframe figures are in CAGR.

The average performance of both NSE and BSE indices in a 1-year rolling timeframe are mostly similar. The mid-cap indices have given 17-20% yearly returns, while small-cap indices have given 20-23%. The 50, 100, 200, & 500 constituent indices which have a heavy skew towards large-caps are not far behind in average performance.

Averages have a way of hiding the outliers if we compare the maximum of 1-year rolling returns, we see surprising outliers from the pre-2000 indices. The maximum returns are almost 2x of the indices which started post-2000. This tells us just how undervalued, underresearched the markets were back then and the market euphoria post-2000 was a mere shadow of what our elders have witnessed before us.

In terms of minimum returns, the returns only the unluckiest investor could get, the data is more comparable across all indices, perhaps this is telling us that the markets do not distinguish between any instrument when panic sets in and everyone wants to get out of everything and that this ability of the market to sell indiscriminately in panic has not weakened with time.

We can ignore the outlier that is the BSE Momentum Index, the index has not seen a full-blown market panic in its lifetime, its older cousin or daddy (whatever you may prefer) the NIFTY ALPHA 50, should be an appropriate benchmark for the fall, momentum strategies can see during tough times.

Indices 1 yr Returns

1 Year

BSE vs NSE – We can ignore the small win for BSE in the Small-Cap indices, BSE’s index was started 8 months before the NSE, BSE captured a lot of the up move in the market and NSE did not. We should also ignore BSE’s win in the 100 & 200 constituents indices as NSE started much after BSE. The 500 constituents indices started around the same time with a difference of 5 months. The 24% outperformance by BSE over NSE was all the result of market direction. Similar story in SENSEX vs NIFTY 50 due to differing time periods.

Amalgamating the above data in the chart below, we can ignore the maximum figure until we reconcile the differing time periods, however, we see small outperformance and underperformance by BSE in average and minimum returns respectively.

NSEvsBSE 1 yr
1 yr

Moving on to the 3-year rolling return data, here, the pre-2000 outliers of the 1-year returns disappear, which tells us that market euphoria or climb does not continue for long, i.e., markets do not keep going up year after year.

What all market participants should notice is that while the maximum and average returns have mellowed down with an extended timeframe, even the minimum returns of the unluckiest investor have reduced. In fact, while the average of maximums has halved, the amalgamation of averages have reduced a few percentage points, the minimums are the real champs here, the averages of minimums have reduced to 1/3rd.

All market participants are getting a lot more wins and a lot fewer losses by just extending their timeframes.

Indices 3 yr Returns

3 Years

BSE vs NSE – We see a similar outcome between the exchanges as above, however, the average of minimum returns have fallen significantly for BSE against NSE. The bulk of this outperformance by NSE is from the 100 and 200 constituents indices and some from the small-cap indices. The first 4 of 100 and 200 indices have decades between them, while the small-cap indices do not. As a counter-argument to time differences leading to lower minimums, the SENSEX and NIFTY50 also have a decade between them but do not see much difference in minimums.

What is happening here is that we are missing the forest for the trees, we are focusing on one time period of maximum and minimum returns. The ideal way to compare the rolling returns would be the average of all these periods. Which smoothens out the effects of outliers. If you feel that averages obfuscate the data, we can compare the average of the highest and lowest (1%, 2%, 5%, 10%, 20%) of a particular set of returns. This is like looking at a part of the forest which is a middle ground between looking at the entire forest and a single tree.

I have calculated the figures for different %s of data to look at and found that directionally, the results are not different from the picture we get from looking at the average dataset.

NSEvsBSE 3 yr
3 yr

Similar story continues for the 5, 7, 10-year timeframes. The minimum returns that any investor can get at even the unluckiest of times, turns positive as the time period extends.

Indices 5 yr Returns

5 Years

NSEvsBSE 5 yr
5 yr
Indices 7 yr Returns

7 Years

NSEvsBSE 7 yr
7 yr
Indices 10 yr Returns

10 Years

NSEvsBSE 10 yr
10 yr

The amalgamated average rolling return data shows that BSE is a clear winner against NSE in all timeframes of monthly, 1, 3, 5, 7 and 10 years. A lot of this outperformance is due to the difference in performance between SENSEX and NIFTY50 which is mostly due to the difference in the length of history. Even when we remove these two main indices in our amalgamation, BSE’s lead over NSE continues in terms of average rolling period returns.

The only indices where BSE loses to NSE is, in the longer periods (5, 7, 10 years) of their respective Mid-Cap indices, and all the periods of their SmallMid-Cap indices.

Indices Monthly Returns

Monthly

The last of the rolling returns graph is for the monthly period, investors should never judge their portfolio returns on a monthly basis, it is too short a timeframe. The only strategies which necessitate a monthly vigil are the momentum-based strategy, which requires frequent rebalancing, even then the investor in those strategies look at the bigger longer picture and knows that monthly outcomes can be negative for some time.

I include this chart just to show how wildly the market can move in a short span of time, any investor needs to be emotionally, mentally ready to see such falls once in a decade on average.

For some reason, on an amalgamated monthly basis, BSE outperforms NSE with its indices but the outperformance is not significant.

NSE vs BSE Monthly

Monthly

Buy & Hold Returns

Below are the charts which depict, the absolute and CAGR returns of these indices since inception. SENSEX is the obvious winner here because of its relatively longer history.

NIFTY ALPHA50 is an interesting candidate here, it has similar inception date to BSE Mid Cap, NSE & BSE Small Cap, NSE 100, & NSE 200 indices. With the exceptions of BSE Mid Cap and BSE Small-Cap indices, the ALPHA50 has outperformed the other with its simple factor-based strategy and concentrated design.

Amongst the Small Cap indices, the BSE clearly outperforms the NSE by 3x even though the difference in their inception dates is only 8 months. This difference in such a short amount of time is a testament to the fact that different starting/ending period of a time series can yield different results.

Indices ABS Returns

Absolute Return

In terms of CAGR returns since inception, the two momentum strategies are clearly giving ample competition to all the other indices. The underperformance of some Midcap & Smallcap indices relative to their larger-cap peers is puzzling, over such long timeframes they should have clearly outperformed. The reason for the underperformance could be the different length of histories, and that, today’s large caps were actually the small caps at the time of inception.

Indices CAGR Returns

CAGR Return

Drawdowns

Below is a graph of the maximum drawdown days for different indices. What these represent is the highest number of days an investor’s investment was below the previous all-time high. This graph throws caution to the buy and hold strategy for the really long term, or adding fresh investments at the market tops. These are just the maximum figures, I have included the individual detailed Drawdown graph for each of the indices in the data folder linked at the end of the post.

Indices Max DD Days

Max Drawdown Days

While the above graph tests the patience of any investor, the one below which charts the maximum drawdowns one could suffer from peak to trough, tests the nerves of even the most experienced investors. Massive erosion of capital in a very short amount of time is a real risk in the market when one is investing near market peaks. Although these drawdowns can often have a V-shaped recovery and one only suffers paper losses, there is something to be said about the lost opportunity cost if one does not keep aside cash in the portfolio for such opportune times.

Indices Max DD

Max Draw Down

Not much to read here, given the magnitude of the drawdowns in both NSE & BSE indices a few days fewer of drawdowns and 6% lesser drawdown would bring a little comfort to the investor who had suffered so much.

NSEvsBSE Max DD Days

DD Days

NSEvsBSE Max DD

Max DD

SENSEX Data Charts Sample

I have included the following charts for each of the indices in the data folder linked at the end. For the rolling returns charts, the return corresponds to the purchase date. The longer the time horizon of the investor, the lower are their chances of a negative outcome in their investment.

The drawdown and drawdown days charts will help familiarise the investors with the fact that equity as an asset class spends most of its time below some previous all-time high. It is impossible to successfully/perfectly time the entry and exit in equity markets. You will never know beforehand what was the peak and trough.

The ST rolling returns chart is a perfect example of randomness, this is why it is hard to be profitable in trading.

The last chart is of the local price peaks, in equity markets it can take years for the previous peak to be conquered.

chart

LT Rolling Returns

Close vs. Date

Index with SMAs

Days in DD

Drawdown Days

DD

Drawdown

Monthly Return vs. Yearly Return

ST Rolling Returns

Peak

Peaks

I would like to end this post, with a phenomenon I have noticed in my limited time in the markets. The life of an investor is always at the edge of regret, sometime you will regret buying/not buying, selling/not selling, someone will always be making more money faster than you, your portfolio may not grow as fast as you want it to. It is also difficult to be satisfied in equity markets, the ones who made 20% returns are looking to double their money, the doubles wants a 5 bagger, the 10 bagger wants 100. Even the 100 baggers won’t rest and want to achieve this feat again and again.

You will notice that market performance is not much different from life, life also has its ups and downs, rarely are people satisfied in their life, most of the successful people in both life and markets follow a structure in their efforts towards improvement, if one does that, they can position themselves on the right side of luck.

Happy Investing.

Data:

  1. Indices Data – https://www.dropbox.com/sh/pj0as504lt4382f/AAAEavzYP-7C0i3WCqsxpduVa?dl=0
  2. Indices Data Sheet – https://docs.google.com/spreadsheets/d/1gG8X5ByujwWKZYyubC1NpuUjDtvkfPqI31YtcPGbcag/edit?usp=sharing
  3. Momentum Indices Data Sheet – https://docs.google.com/spreadsheets/d/1VbI7ns_yrZAiO5q_-0szKCT0TR6JFL_wGCTyDoGXYU0/edit?usp=sharing
  4. ITC Price Data Sheet – https://docs.google.com/spreadsheets/d/1IFGgyLBNzzxed7Xva2JYyIgmWtKSmSiAD6irY5arpXI/edit?usp=sharing
  5. ITC Data Charts – https://www.dropbox.com/sh/mynbr45it5lbr25/AAA1-kiqMuPZQYUwiNSw23kPa?dl=0
Standard

Using Pivot Tables/Charts, Slicers & Screener to Semi-Automate Historical Peer Analysis

Firstly, I would like to deeply thank Mr Pratyush Mittal and his team at Screener.in for developing this amazing website and making it freely available to everyone to use, without them this project would not have been possible.

A brief introduction to pivot tables and charts, they are a really handy tool that is a must-learn for sorting and analysing data in Microsoft Excel. I learnt them myself a few weeks back, it is something that almost everyone should be able to use after watching a few videos on Youtube. I have already created a blank template for this tool, and even people who do not fully know how to use these tools can simply copy and paste the raw data and be ready to compare any companies of their choice within a few minutes.

If you are already familiar with Pivot Tables, Pivot Charts and Slicers, you can download the data from any of the below links and get started. If you are not, I recommend watching a few videos to familiarize yourself with the tools before using the templates.

Dropbox

Google Drive

One Drive

I will explain the procedure to use the template below. This links above will download a folder named “Company Peer Comparison”, once it is downloaded, open it.

In it, you will find 2 folders and 2 files. Starting with the folders first, the “Industry Wise Data” folder contains the past 10 year and 10 quarter data for major companies in major sectors all ready to analyze. I have included most companies in every sector, which were above the 500 cr market capitalization threshold.

Click on any of the excel sheets and the sheet should open to the “PT Chart” worksheet. Most of the sheets will have 2 charts in this worksheet, one for “%” figures and another for “Absolute” figures. Do not worry if your screen does not show the entire sheet, I have sized the sheets as per my screen size. You will have to resize the charts, slicer tables as per your screen size to make full use of the tool. Your worksheet should look like the image below.

Screenshot 2020-01-24 09.26.43

On the right, you will find the slicer tables which you can use to get different parameters on which you can compare the companies. This template has over 50+ parameters to choose from. To select multiple parameters to display in one go you just need to have “ctrl” pressed on your keyboard and select the parameters you wish to display simultaneously. You can do the same for the company slicer table, select anywhere from 1 to all companies to view their historical figures. You can even choose to only view quarterly or annual data or both.

Due to limited screen size and excel capabilities, the template works best for comparison of a few companies, up to a 10 is manageable. Beyond that, you may have to sort the companies into sub-segments for the chart to be readable. I have already done that for a few industries where the number of companies was too many to display at once. Try not to select all the data points at once, that can sometimes make your excel crash if your system is not powerful enough and the chart becomes unreadable anyways.

Although 10 years and 10 quarters is a good enough timeframe to compare companies, as the years pass the time series will grow if one keeps adding the recent data. We are limited by the number of data points that Excel can take. I will test the limitations of the template in the future. Once we have enough data, say for 2 decades, I can revise the template, to slice for specific time periods and view the time series data like a 3 or 5-year moving picture.

Sometimes some company’s particular data will be totally different from the sector due to various underlying factors, and the chart may not display the smaller figures properly. You can use the company slicer tab to remove that particular outlier company to get a standard chart. The “PT Chart” worksheet has 2 charts for most of the industries, one is for absolute figure comparison and another for %. scroll down to see the 2nd chart. In a few industries where segmented data is available, I may put more than 2 charts in this sheet. Be sure to scroll down to see all the charts.

As you will notice I have left out the industry data for financial services industry, including banks, NBFCs, AMCs, Insurance, and Broking. These industries have unique KPIs which need to be manually entered from their respective Investor Presentations. You will find the templates for these in the “WIP” folder. This is a work in progress that I have just started and will take time. I have introduced more segmented data based on loan books, capital sourcing, ticket size, geographic distribution, NPAs etc. in these templates. If you are interested in this sector you can take this forward with these templates. If you want to add just the screener data for these industries you can follow the steps below.

Create your own Customized Comparisons

The other two excel sheets in the folder, namely “Astal Poly” and “Blank Industry Data” is what you will need to customize and compare the data for the companies that you want to analyze.

Just go to the link below and upload the the “Astral Poly” Excel sheet to the screener website.

Screener Excel

Now search for the company you want to compare in the screener, and export its data to Excel via the link on the top right of the website. Repeat for other companies that you want to compare.

Open this downloaded file and the excel should open by default to the “PT Data” worksheet, if it doesn’t, select it. The tabular data should already be selected for you, if it is not, select the data in the table, without the headers.

Open the “Blank Industry Data” excel sheet, it should by default open to the “Data PT” worksheet. Right-click on the cell that reads, “Ambika Cotton Mills” and then paste the data as “Value”. This step is important, paste the data only as value or else it won’t work. The last column in the table, the “Parameter Type” should populate automatically as the data is entered, if it is not, just copy the formula in the 1st row of the column to other rows.

Repeat the same steps above for the data on other companies that you want to compare. Make sure that there are no blank rows in the table, or the pivot table won’t work.

Once you have all the data copied to the “Blank Industry Data” excel sheet, go to either the “ABS PT” or “%PT” worksheet, right-click on the blank pivot table on the top left. Usually, it should be in the cells A4-B6. Click “Refresh” in the drop-down menu, and the pivot table should populate itself with the data that you had copied beforehand.

At this time it would be wise to “Save As” this excel sheet as per the name of your liking. This will save our work up until now. Now just go to the “PT Chart” worksheet and your PivotChart and Slicers should be ready to use.

If the Pivot Chart and Slicers are not all visible together in your screen, just go to the “Blank Industry Data” excel sheet, go to the “PT Chart” worksheet and resize them to fit your screen and save the template. This will ensure that you will not have to resize them again and again for every comparison that you do.

Updating the Comparison Sheet

Updating the old data with new quarterly, Financial Year figures is easy. Just download the respective company excels from screeners at the relevant time. In the “PT Data” worksheet, go to the time period header in the data table, select the data parameter for the latest time period you want to update (ex. Q3FY20 or FY20) and just copy-paste the new data as value to the old comparison sheet. You can copy-paste the data in any order, the pivot table will sort it out.

After you input the new data, just go to any of the pivot table worksheets, right-click on the pivot table and click refresh. The new data should be updated automatically. That is all.

Time Period Sorting

In the template, the data is already sorted for time periods from oldest to recent. This is important as the data needs to be sorted for time periods in the pivot tables worksheet, and this is how it will appear in the Pivot Charts.

If in future while adding new data the sorting is broken follow the steps below.

Firstly, the automatic sort function in excel does not work on these headers. So here is what we do.

If the time periods are totally random – Find the oldest quarter, right-click it, and press first “M” and then “E” on your keyboard to move it to the end. Ex. for recent quarter data the oldest data is for Q1FY18, right-click it and press “M” and “E” on your keyboard. Q1FY18 will shift to the rightmost column. Repeat this for Q2FY18, Q3FY18 and so on until you reach the latest quarter. Repeat the same for financial years if they are not sorted. You can choose to display them to the left of the quarters in the chart like I have or the right. To move the financial years to the left, right-click on the most recent financial year, ex. FY19 and press “M” and then “B” on the keyboard. Repeat the same in descending order.

If only the latest quarter is not in order, just right-click it and press “M” and “E” on your keyboard to move it to the end. If the latest financial year is not in order, right-click it and press “M” and “U” or “D” on your keyboard to move it left or right until it is in its rightful place.

For Power Users who want to Customize

If you know how to use the “INDEX” function in excel you can you can customize and add your own parameters to the screener sheet in the “Formulae” worksheet and link those cells to the table in the “PT Data” worksheet.

I have hidden the columns in the PT Data worksheet which convert the time periods from the Screener’s date format to quarters and financial years. I have tested the formulae and they work for new incoming quarters as well as for some weird data time stamps that some companies may have. If this feature breaks just contact me and I will try my best to sort out the issue.

If you want to add industry-specific KPIs from the relevant Investor Presentations into the pivot data you can do that as well but it has to be done manually. Just make sure to update the legend on the right of the “Data PT” worksheet for the “Parameter Type” column to update itself. If you introduce some new parameter type into the legend, you will need to update it in the pivot table as well. Usually, it will be in the drop-down menu at the top of the pivot table next to the parameter type cell. Make sure to add the absolute figures in the “ABS PT” worksheet and percentage figures in the “%PT” worksheet for optimal use.

I created this template because I was unable to find similar comparison and customizability options anywhere. If you find this tool useful, please do share it in your investing circles. I believe it will truly benefit the analysis capabilities of all investors.

I also believe that if the data is available the templates can be used in other markets as well. It will open an avenue for comparison and benchmarking with global peers. If you are aware of such semi-automation possibilities in other markets and would like to collaborate contact me on abi.mehrotra@gmail.com

If you face any problems with the template you can contact me on the address above. I will try to solve the issue as soon as I can.

Happy Analysing!!!

Standard

Indian Asset Management Industry: A data History

The best place to learn about the history of the asset management industry is definitely the industry’s regulator website, https://www.amfiindia.com

The history as per AMFI is divided into 4 phases: (MF History)

First Phase – 1964-1987

Unit Trust of India (UTI) was established in 1963. At the end of 1988, UTI had Rs. 6,700 cr of AUM.

Second Phase – 1987-1993 (Entry of Public Sector Funds)

1987 marked the entry of non-UTI, public sector mutual funds set up by public sector banks such as SBI, Canbank, PNB, Indian Bank, Bank of India, BOB, LIC & GIC between 1987 & 1992. At the end of 1993, the mutual fund industry had AUM of Rs. 47,004 cr.

Third Phase – 1993-2003 (Entry of Private Sector Funds)

1993 marked the entry of private sector funds. At the end of January 2003, there were 33 mutual funds with total assets of Rs. 1,21,805 cr. UTI alone had Rs. 44,541 cr of AUM.

Fourth Phase – since February 2003

In February 2003, UTI was bifurcated into two separate entities. One is the Specified Undertaking of the Unit Trust of India with assets under management of Rs. 29,835 cr. The second is the UTI Mutual Fund, sponsored by SBI, PNB, BOB and LIC.

Let us update this a bit

With the traditional well-known history out of the way, I would like to update this with different growth phases that the industry as a whole has witnessed since 2003. The industry is well established now, has seen several growth peak and troughs along the way. Many players have tested the waters since 2003, very few have been successful, a select few were acquired. This industry is one of the big fish getting bigger due to branding, scale advantages and gobbling up the small fish as they came across their path.

As per the AMFI MF history above, since the entry of private sector funds, the industry AUM grew at a CAGR of 9.9% between 1993 and 2003. This was a big turmoil phase for the markets with the IT boom and bust occurring in between. The dip that is seen on Mar-03 is due to the UTI’s SUTTI stake being declassified from the industry AUM. Goes to show how big UTI was at the time.

Here is where the 4th phase as stated above starts for the industry, from a low of 79,464 cr in Mar-03, the AUM for the 1st time crosses the 6 lac crore mark and peak around that. Over the next few months, as the GFC (Great Financial Crisis) unfolds, the industry AUM is cut 1/3rd from its peak to around 4 lac crore.

Total Industry AUM

Chart 1 – Industry AUM, DB Link –

The markets swiftly recovered and with it the industry AUM, but the second chart is what really depicts how volatile the degrowth and growth was during this time. The AUM swiftly move to 8 lac crore by Nov-09, which marked a peak until Jan-13. That is 3 years of stagnation AUM. The period from Feb-03 to Nov-09 can be marked as the fourth phase of the industry, during which, perhaps for the first time, the majority of industry professionals, investors and other participants saw just how brutal the markets can be.

Total Industry AUM YoY Rolling Growth

Chart 2 – Industry AUM Rolling YoY Growth, DB Link –

The fifth phase, which I believe we are currently in, starts from Nov-09, during which the industry growth was shallow with a negative bias until Jan-13. This is well marked by the chart below, where the 3-year rolling return turns 0. The first dip in 3-year growth is an aberration due to the SUTTI declassification and can be ignored.

Total Industry AUM 3yr 5yr Rolling Growth

Chart 3 – 3 & 5 yr Rolling growth Industry AUM, DB Link –

Since then, the industry has grown leaps and bounds, with AUM growing from ~ 8 lac crore in Jan-13 to ~ 27 lac crore in Nov-19.

Total Industry AUM 7yr 10yr Rolling Growth

Chart 4 – 7 & 10 yr Rolling growth Industry AUM, DB Link –

The industry has not seen a down year in AUM since 2012. The rolling YoY AUM growth has been positive since then, but we can see the growth engine sputtering in all the charts above.

It is interesting to note that the industry as a whole is known to be in its growth phase, it is far from a mature industry. The 3, 5, 7, and 10-year charts reflect that. Even over a smaller timeframe of 3 years, we have seen the industry’s AUM stagnate only once since 2002.

It can be well pointed out that this stagnation was due to the comparison between market peaks and troughs. This is true, but what I want to point out here is that there is minor cyclicality in the AUM which is the raw material of the industry.

Over small timeframes of a year, the growth does become negative several times, over longer timeframes the growth is cyclical, almost matching the performance of the markets. One can argue whether the markets perform well due to the incoming AUM or the AUM gets boosted due to investors watching the market perform well.

Another detail that is revealed from these graphs is that as the industry is gaining scale, the AUM growth along all the timeframes is reducing in quantum. Here is some data on this, anyone would consider greater than 20% YoY or CAGR growth phenomenal since that would be almost 1.5 to 2x our nominal GDP growth over this timeframe.

Let us take that as a threshold growth rate, the industry in the previous growth phase maintained a growth rate above 20% for a period of 4 to 5 years continuously overall timeframes but in the most recent growth phase, the above 20% growth rates were not only maintained for a lesser duration, even the quantum of growth above the threshold was smaller.

The growth figures seem to have peaked in the near term with growth across all timeframes slowing down.

Why is this happening? Here are the underlying charts which reflect the inner workings of the industry.

In absolute terms, the annual purchase and redemptions are growing, but the net inflow (RHS) in the latest year is comparable to the inflows that were witnessed 10 years back. This is better illustrated in chart 8.

Industry Annual P.R.NF

Chart 5 – Industry Annual Purchase, Redemption & Net Flow (RHS), DB Link –

Annual Industry Purchase Rolling Growth

Chart 6 – Annual Industry Purchase Rolling Growth, DB Link –

Annual Industry Redemption Rolling Growth

Chart 7 – Annual Industry Redemption Rolling Growth, DB Link –

Annual Purchase, Redemption & Net Inflow as a % of AUM

Chart 8 – Annual Purchase, Redemption & Net Inflows (RHS) as a % of AUM, DB Link –

Net inflows as a % of AUM are volatile, with degrowth in some years. The inflows as a % of AUM did not witness similar peaks in the 5th growth phase from Nov-09 onwards like they did before that.

The growth in purchases and redemptions across all timeframes are also dropping from historical highs but they started at very high growth rates and had sustained that growth for more than half a decade until Mar-10.

What this leads to is very interesting, as seen in Chart 8, since Mar-02, the annual redemptions and purchases have been more many times the size of the whole industry. The implications of this are that the whole industry AUM is churned multiple times in a year, generating lots of fees for the middlemen in the transaction.

The good part is that the majority of this churn comes from money markets and liquid funds which are designed as such. I would have liked to support this statement with more data and charts, but unfortunately, AMFI does not share annual purchase, redemption data for individual segments, they share it in a monthly format, with no cumulative figures given at the end of the financial year.

The annual purchases and redemptions when compared to the whole industry have stagnated since 2013. If only I could segregate the purchase and redemption data further into debt and equity to analyze how differently they are have contributed to this trend.

Equity Segment

Now we will have a small look at how the equity segment of the industry has grown. If we follow the highs and lows of the Equity AUM as a % of Total Industry AUM, we can see that the peak and trough can be somewhat used to build a prediction model for equity market overheating and buying opportunities. Unfortunately, the dataset is small, absolute clear buy, sell signals are not present. For example, the fall in equity participation in 2007-08 was not as severe as in 2003. One of the reasons for this could be that these are financial year-end figures, whereas the market bottom could have been in mid-year. I am confident that if we use monthly or quarterly AUM figures we could arrive at better signalling data.

Equity AUM vs Total AUM

Chart 9 – Equity AUM vs Total AUM, DB Link –

Equity AUM growth witnesses higher peaks and troughs than total industry AUM growth does.

Equity AUM vs Total AUM Growth

Chart 10 – Equity Growth vs Industry Growth, DB Link –

Equity AUM & Net Flows

Chart 11 – Equity AUM and Net Equity Flow (RHS), DB Link –

In the years, 2011, 13 and 14, the net inflow into the industry was negative. While in 2011 and 12 the Equity AUM actually reduced YoY, in 2014 it actually increased despite outflows. The only way I could explain this was that the market rallied and increased the AUM figures on a net basis.

Change in AUM Vs Net Flow

Chart 12 – Change in Equity AUM vs Net Flow, DB Link –

This is interesting to see, the years when the blue bar (change in Equity AUM) is higher than the orange bar (net inflow), those are the years when markets performed well or had some gains like in FY 10, 11, 13, 14 15, 17 and 18, while in the years when markets lagged or fell the reverse is true, like in FY 09, 12, 16, and 19.

We can dissect this in other ways as well, like match AUM with cumulative net flows, but I believe we get the picture and I will leave this here.

AUM Market share

Last but not least, the market share time series for the top 16 in the industry. I had figures for all participants but I had to cut it down to >1% market share winners. The chart became absolutely useless.

A few things to note, UTI is a mere shadow of what it used to be, guess that is the case for all PSUs nowadays. There are definite scale, branding advantages in this space unless the management wants to ruin the company. Through acquisitions and creeping client acquisition, the big are getting bigger.

These top 15 used to represent about 65% of the industry until 2005, they have grown to become more than 90% of the industry.

AUM Market Share Top 15

Chart 13 – Top 16 Market Share Time Series, DB Link –

I will continue tracking this space regularly, I am all up for more data transparency from AMFI.

I am deliberately staying away from the fundamentals of the industry like individual company’s scheme performance, expense ratios, profitability etc. I know these will play a big role in how this sector will shape up. The data to be collected on this is so huge given the number of schemes from each fund house, the comparison would be extremely time-intensive. A subset of this with profitability, the efficiency of each player in the industry could be an interesting next project to work on.

For those interested in more data, there is other data available on the AMFI website as well, which goes in further segmentation of AUM, investors by geography, unfortunately, the data is not available as a time series.

I have attached dropbox links to each chart, in case they are too small to view on this website.

Caveats:

  1. While I have tried to maintain top quality in the data collection and have corrected a few mistakes during the process, I cannot guarantee that the data is a 100% error-free. If you find any absurd figures you can check them up at the AMFI site.
Standard

The Problem with India

This post is written in the afterthought of reading a post written by Mr R Balakrishnan on foreign investments in India.

Link: https://balablogsdotcom.wordpress.com/2018/08/07/the-search-for-large-investments-by-funds/

Bala, great piece as usual. The problem here is more structural, in that we are a net importer by a huge margin. Usually, when imports and exports are balanced, the FOREX earnings from exports cover the FOREX spending from imports in the country’s net account. But when imports are disproportionate, the importers buy FOREX indirectly in the international markets, and as domestic currency is accumulated in the international markets its value is diminished due to demand, supply dynamics.

As this domestic currency changes hands in the international markets, it needs to find a way back to the country of its origin, as it is useless in every other country, only unless it is the reserve currency.

Now to avoid, large-scale currency devaluation the domestic government has to either buy this domestic currency held by foreigners or provide avenues for that domestic money to come back to the country in the form of investments. Such investments create artificial demand for the domestic currency.

In case of the US and China, we see America giving up its Real estate and shareholdings in companies to provide that investment avenue to the $ held by the Chinese. $ being the reserve currency helps the Chinese buy-up assets all over the world as well.

In our case, I do not have the figures for foreign investment in the Indian Real estate but most of it goes into shareholdings of listed companies or set up of new businesses.

While what you say is possible, that foreign companies earning their profits from India should provide avenues for Indian investment into them. It is not as easy as letting Indians open foreign investment accounts with Interactive Brokers and investing in these companies. Such investments would only escalate the currency demand-supply dynamics that I have discussed above.

Forcing companies to list their shares in domestic currency terms is a way out but I find it highly divergent from a free market perspective.

Instead of forcing laws on someone, which is the easy way out, we should be focused on balancing our imports and exports better. This will remove the need for foreigners to invest in our domestic assets.

While increasing our exports to match our imports is a tall order given the foreign competition in foreign markets, I believe it is much easier to provide import substitution for our imports.

As for foreign companies benefiting from our consumption story, an easier domestic to foreign investment policy to facilitate such avenues for every Indian will be the best solution and with no pressure on the currency from import, export imbalance such remittances from India to abroad will not add to the pressure already faced by our currency.

The talk over the last few years has been to grow by following the example of our Asian neighbours, Japan, South Korea & China by exporting our way to prosperity. But better than growing through exports in a highly competitive market, we should first aim to be self-sufficient in a domestic market where we should have a better competitive edge.

Our population provides us with the means to reach manufacturing economies of scale in all products. Once we are self-sufficient, we can think of competing against others in foreign markets. If we cannot compete with them on our home turf what chances do we have in a foreign place with global competition?

But sadly, the situation is such that we need to protect our domestic industries with customs duties. Which is a stop-gap solution at best. In some cases, even after a labour-intensive product is manufactured in a high capita country, with added logistic costs and customs duties, the imported product is still cheaper than our domestic product.

We have added inefficiencies after inefficiencies in our production value chain by subsidizing the citizens and penalizing the industry. A few examples are the differences in power costs, freight vs passenger costs in railways. The industry is always seen as a scapegoat to fund the political ambitions of those in power.

Government after government tries to fund their subsidy programs by penalizing the industry through irrational pricing of inputs such as mines, ores, spectrum etc, inadequate infrastructure spending and thoughtless lawmaking to gain popularity. While our competition provides special concessions for the same to help grow the nation as a whole.

In the end, it all comes down to the kind of people we are. We expect dole outs from our elected leaders for our personal short-term gains. We never ask what will the representative do for our country we only ask what will they do for me, my family, and my community.

Someone has said it best, “the citizens get the politicians they deserve.”

This is how I see it, all our problems are interconnected and no one measure will help solve the imbalances. It is like the traffic problem, if we solve the traffic snarl at one junction, we find that the problem has shifted downward to the next junction.

There is no easy way to build a nation, a nation the size of ours requires planning and effort from all its citizens. But most of the measures that I have recommended have intangible results with positive externalities that are distributed to everyone over the long-term. But no one wants that, impatience for short-term selfish benefits and results create negative externalities that are distributed to everyone over the long term.

In the end, I feel we Indians must be born with some special kind of selfish gene to see our nation rot in so many ways and still not mend our ways.


Standard

AIA Engineering Ltd. Q4FY18 Conference Call Notes

Q4FY18 Conference Call Notes: While full care has been taken to maintain the accuracy, please refer to the original conference call recording for more insights.

66 kT in this quarter up from 51 kT from Q3 & 58 kT from Q4 last year. 37 kt from mining. The full year is at 228 kT of sales, around the 230 kT we guided last quarter.

2375 cr of Revenue, Q4 was 720 cr, up from 556 cr from Q3 & 608 cr from Q4 last year.

108 Rs/Kg realization based on partially, price increases, RM volatility pass through, product mix etc.

RM is at 35 days. WIP is at < 60 days. Receivables at 80+. WC cycle is at 100 days.

Mining FY18 was at 139 kT. Was at 100 kT in FY16.

This year tax was at 25% of PBT because of tax reversal on 3+ year of treasury income.

EE Mills Solutions Collaboration

We offer mill solution in cement space, for power saving and process optimization. This tie-up helps us to provide save improvements for grinding mills in mining segments. We will be one of the very few companies who will be able to offer such solutions.

This gives us an additional touch point to engage with the miner, it improves our relationship with them, power is a big cost for miners as well. It makes us a formidable player as a solution provider to the mining industry. This was one area, process efficiency, we were not able to focus on. With this patented technology we become a one-stop shop and improves our positioning.

This is a very unique patented technology, it makes dramatic improvements in the processes and costs for mining grinding circuits. It helps us in getting a lot of customers for liners and in the process opens avenues for us to sell our GM solution to more customers at a quicker pace.

We have been slowly evolving and improving our positioning with the miners. We started 4 years back as a pure cost equation, then we focused on downstream efficiencies, like reduction in costs of other consumables like cyanide etc., then we wanted to optimize the whole grinding process.

Like we say we are experts in cement grinding, we want to be in the same position for mining where we cater to every requirement of the customer.

It is an exclusive agreement, Customer acquisition is less time intensive than HCGM. Revenue opportunity can be $2-3 per Kg, Scheduled 250 cr CAPEX (1st estimate) which will complete in 18-24 months and have a capacity of 50000 MTPA. We already have the land and pollution permissions.

Will be based on royalty. They will be HC liners. They help mines save 8-10% of power costs. The focus will be on improving power costs and throughputs not wear costs.

For steel liners, annual market consumption could be 300-500 kT annually. We have 2 large suppliers and 2-3 smaller ones supplying the conventional design. This tie-up will be for all geographies. Current mill liners are already all chrome but it is low chrome which is a standard product.

Competitors: Bradken, Elecmetal and 2 others. Market Share: 60-70% by these 4. We are offering a different solution, which has to do with optimization. Their product has nothing to do with the process. We believe we will be pioneers with this tie up.

We will design the mill lining and load it with our GM. It will become a whole package. Reduce power costs, optimize the mills, improve throughput, increase recovery. This is a strategic move for us to engage at a different level with the customer to become a one-stop solution. Most of the other competitors are not in HCGM so we will be the only ones who can offer the complete package.

We do have limited production capability (5-10 kT) for this product currently and we can start servicing a few clients. Trials have started. We are not going to wait for initiating the sale of this product while we wait for the commercialization of the capacity.

There is no difference in product, it is a different patented design solution. The cost to manufacture may & may not be same. We expect but cannot generalize the benefit. It will depend on the milling conditions of the mill we target. It will not be that everywhere we go, we can offer a solution and benefit, we believe the benefit will be significantly more than 8% but that is something we will know after studying individual mill conditions in different geographies.

Cost of consumables will remain same for customers, but the total cost of ownership will reduce. This is not a standard design, it will depend on mill conditions. JV partner is not a manufacturing company. It is owned by a professor in the USA.

We will pass on the royalty expenses with the pricing.

CAPEX

Spent 138 cr this year 50 kT increase. One of the suppliers of this project, a European company went bankrupt. We expect to get this up by next quarter with the equipment we have. Should complete by Dec 2018. Next phase will be in next 18-2 months.

Considering to invest in 8 WTGs, as power is one of the biggest costs for us. Bought 2 already and signed Letter of Intent for next 6. This will be 100 cr CAPEX. Total CAPEX will be around 800 cr. Will spend 400-500 cr this year and balance next year. Includes maintenance CAPEX for 2 years, 400 cr for GM expansion and balance land.

Guidance for 40 kT additional volume this year. That would mean 270 kT production, well within our current capacity.

Aiming to add 80-100 kT volume in next 2 years.

Currency depreciation has helped us but some exports are cross currency and so if that currency depreciates move than INR we are at a disadvantage.

Brazil ADD

Have requested for an in-person hearing, to be announced in June, Have made public their technical analysis based on which duty comes to be around 12% from 32% at this time. This is an internal technical note, not the final duty decision.

Exports continue currently.

Depreciation

Has reduced because one of our biggest plants commissioned in 2007 has been fully depreciated and fallen from the depreciation schedule. Was running the new plant in one shift and will soon start more shifts in it and depreciation will increase.

Margins

The price change is a continuous process, every new order is at a new very very competitive price. There will be a slow increase in price with customers who have become steady. It will keep on happening. Margins currently in a reasonable range. There will be pressure as we have to make greater inroads into the mining segment. There is no formula.

Sales guidance is over years, not quarters, our business is not like that, we have been very clear. You can’t divide annual guidance by 4 to get quarterly guidance.

Currency

The benefit of the currency will come in Q3, we have taken hedges. Our position is to be FOREX agnostic. It may be an extra tailwind or headwind in our BM but we work without its help.

Standard

Ujjivan Small Finance Bank Annual Report FY17 Notes

This is the eleventh post of the series, where I will share notes taken by me while reading the annual reports of this business. I will be sharing an excel sheet at the end of the series which will capture all the relevant data throughout the years of its operation. Notes will mostly contain intangible non-financial data which will reveal subjective characteristics of the business and management. I have restrained from adding my comments and recommendations on specific subjects as I do not want to introduce my biases in this exercise. Shorthand abbreviations are used from time to time and should be logical. For any clarification, please use the comments section. This is not a buy or sell stock recommendation, just an exercise in researching and understanding the business.

Won 3rd best place to work in India and 10th in Asia (only Indian organization in the list), #1 in MFI.
Won Platinum SKOCH award for inclusive insurance, based on the company’s financial inclusion initiatives, exceptional customer service, insurance penetration and for covering the highest number of lives through insurance. Ujjivan’s focus on Education through its Common Group Training and Financial Literacy program, Assured Reach and Access, backed by a 100 % claim settlement ratio were the key factors instrumental for it winning this award. Ujjivan was also awarded the SKOCH Order-of-Merit for qualifying amongst the Top 100 Projects in India.
Ujjivan Financial Services
Message from Chairman
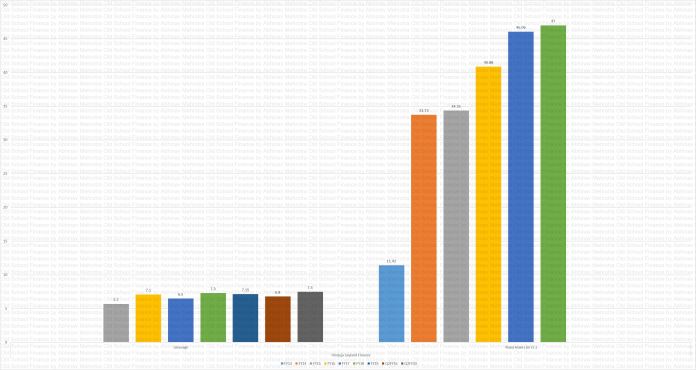
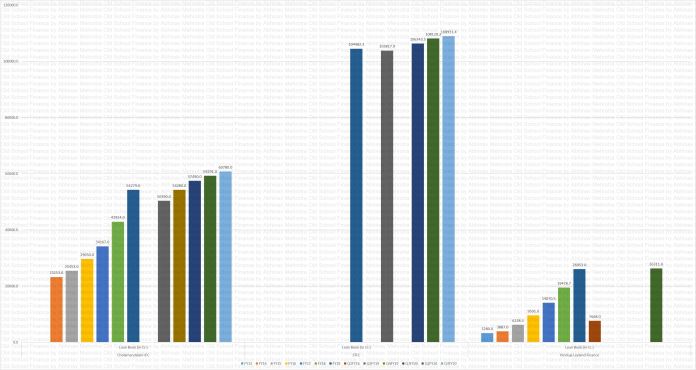
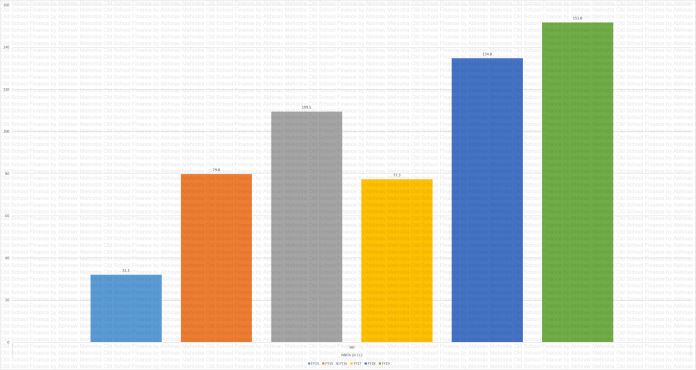
From modest beginnings in 2004 your company has emerged as one of the largest MFIs in the country in terms of geographical spread with pan India presence through 470 branches across 24 states and 209 districts and a loan book of around Rs 6500 crore, serving 36 lakh customers. We have not swerved from our mission and remain totally dedicated to serve the financially unserved and underserved community. We have consistently earned customer accolades by forging strong, meaningful & empathetic relationship with our customers, thanks to our dedicated front line and service quality teams. As a service entity, we are always conscious that human resources are our greatest assets and our organizational human resources policies and practices mirror this.
Why did we become a Bank may be the upper most question that may linger in your minds. Lack of access to savings is often referred to as the “forgotten half of rural finance”. More than the “loans”, the poor need a trusted formal saving channel, shorn of rigidities, to keep their savings. Savings should precede loans. Due to regulatory constraints, hitherto as a non-banking finance company, Ujjivan was not permitted to accept deposits from customers. In our broadened role as a bank, we can provide savings products apart from loans and other financial products with which two benefits will accrue.
Firstly, our access to savings from customers and public at large will reduce our funding cost, which in turn could benefit the borrowing customers by way of lower interest. Secondly, once our customers inculcate savings habits, they would be able to better manage their cash flows and avoid over-indebtedness and consequent debt traps.
Why two separate entities “Ujjivan Financial Services Limited” and “Ujjivan Small Finance Bank Limited” (hereinafter referred to as “USFB” or the “Bank”) could be the other question that may arise. One of the key regulatory requirements for setting up a small finance bank is that the promoters/promoter group should at least hold 40 per cent of the paid up capital of the bank, which should be locked in for a period of five years. Rationale for this regulatory prescription is possibly to ensure “stability in the shareholding of the bank” in the initial years of formation. As Ujjivan did not have any promoter/ promoter
group, we opted for the “Holding Company Structure” and transferred our operational business undertaking comprising of the assets and liabilities to “Ujjivan Small Finance Bank” through a slump sale. Post formation of Ujjivan Small Finance Bank, Ujjivan Financial Services Ltd., the Holding Company will be registered with the RBI as a NBFC-Core Investment Company. As the holding Company it will exercise its oversight function, provide support and funding within the legally permissible ambit thus managing its investment in the bank.
Mr Samit Ghosh assumed the leadership mantle of the Bank as Managing Director & Chief Executive of the Ujjivan Small Finance Bank, with the prior approval of the RBI. Ms Sudha Suresh, formerly the CFO of the Company, assumed charge as the Managing Director and CEO of your Company.
The major disruptive event we faced during the year, perhaps in our decade long journey, was “demonetisation”. While the move will yield positive benefits to the economy and the public at large in the medium term, the immediate negative fallout has been on a vulnerable sector like microfinance business. Given the fragile cash flows of our customers, their income and business activities were severely affected across various pockets. The resultant impact has been lower collection efficiencies and increase in Portfolio at Risk. Closely on the heels of demonetisation, loan waivers announced by some state governments for agricultural borrowers raised the expectations of microfinance borrowers too. Relentless efforts are on to educate and persuade the borrowers to adhere to repayment schedules. In justifiable causes, loans are restructured. There has been positive support from the industry network and Governments through appropriate media announcements. Loan collections are picking up gradually and we expect the situation will improve in the months following.
Letter from MD – Sudha Suresh
‘Ujjivan Small Finance Bank Limited’ was incorporated on July 04, 2016 as a wholly owned subsidiary of the Company. The Company, then submitted an application to the RBI for grant of banking licence to its subsidiary and based on the application submitted, the RBI issued Ujjivan Small Finance Bank the Licence No. MUM 123 dated November 11, 2016 to carry on Small Finance Bank business in India. Pursuant to the receipt of various approvals from the RBI including the approval for the Board and host of other registrations and regulatory compliances on which the licence was granted, ‘Ujjivan Small Finance Bank Limited’ commenced its operations as a Small Finance Bank with effect from February 1, 2017.
Ujjivan always had a robust risk management framework for its operation as a MFI. With the transition to a bank, we set up an independent Risk Management & Compliances department to manage various risks and compliances . Apart from the controls for Ujjivan’s existing lines of business as a MFI, we set to address additional risks as it transitioned to new products, IT systems and processes aligned to the banking requirements with requisite softwares and systems. This included EGRC and ALM solution for effectively monitoring various aspects of Credit, Market, Liquidity, IT and Operational risks. Compliance framework focused both on micro level obligations for branches and departments and macro level management of regulatory/statutory interactions, regulatory audits, policies, products etc.
Post the receipt of the final license from RBI on Nov 11th 2016, the team were all set for an exciting journey obtaining various approvals and licenses from RBI and other authorities. There were around forty approvals and permission including Bank Code, INFINET, RTGS ,NEFT ,Rupay, NFS, IMPS,AEPS, RBI Current Account ,SGL etc. required for the launch of the bank.
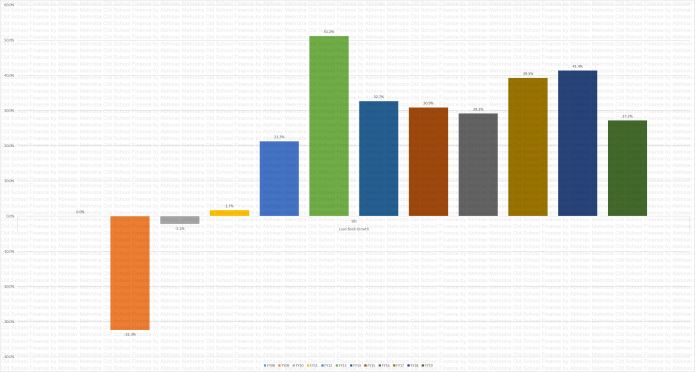
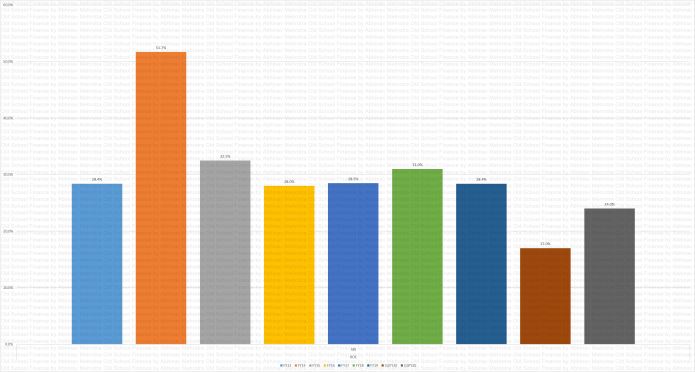
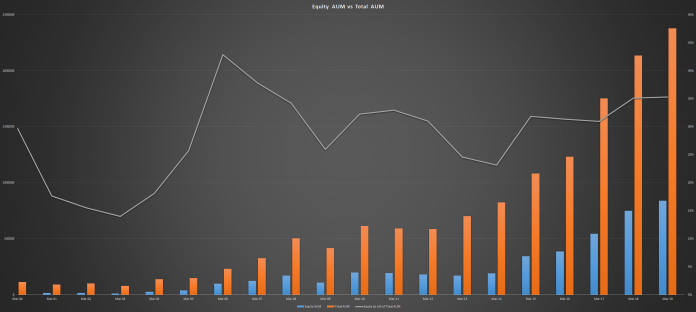
As we were walking the transition path, our business growth was maintained parallelly. We sustained a robust growth in our overall portfolio which grew by 18.4%. We focussed on Affordable Housing and Micro & Small Enterprise (MSE) growth this year apart from a stable growth in the Microfinance vertical. We ensured growth across all our branches pan India, thus minimising concentration risk of our portfolio.
With a successful capital raise at the beginning of the year and better credit ratings, we were able to leverage and raise debt at lower costs, the benefits of which were passed to the customers through reduced interest rates during the year.
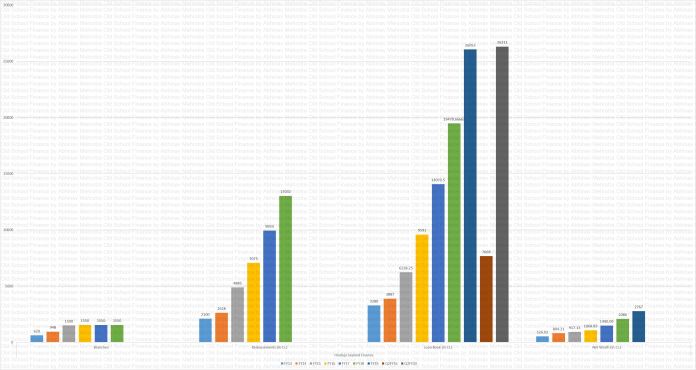
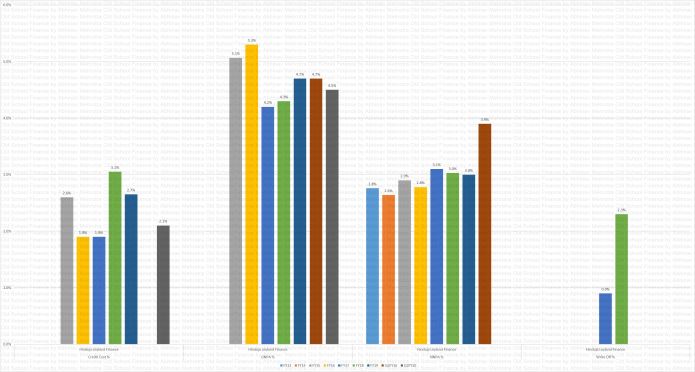
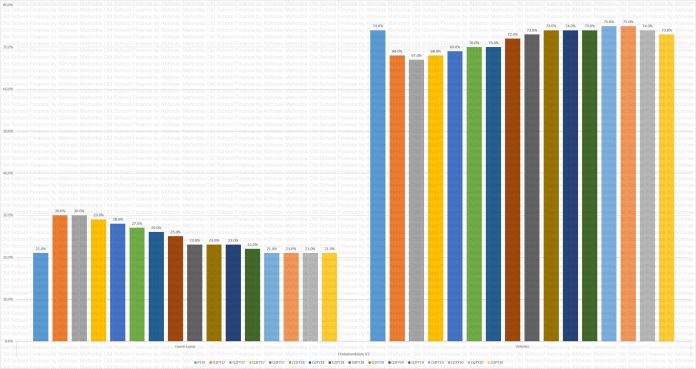
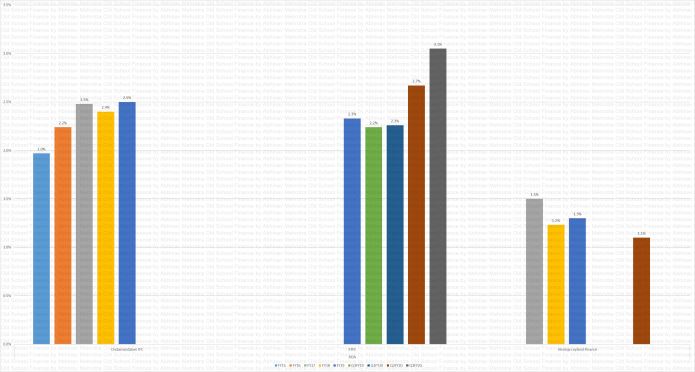
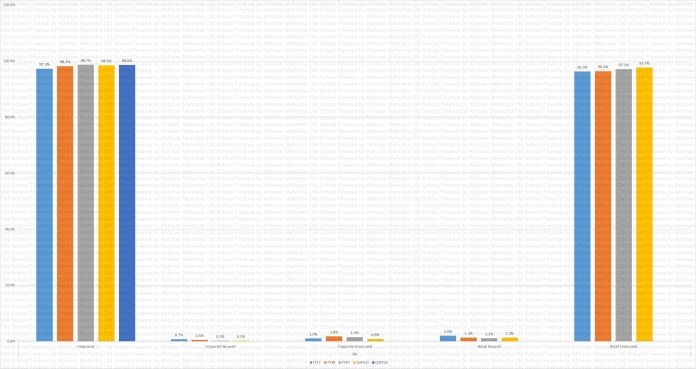
Demonetisation came as a critical challenge for the entire Microfinance Industry. So though the first half of the year closed with an excellent set of numbers, the impact of demonetisation was evident in the second half across key parameters including business growth, new customer acquisition, collection efficiencies and Portfolio at Risk. Tremendous efforts and initiatives by various teams enabled customer awareness and collections over the next few months albeit with a time lag. Post demonetisation RBI had also come out with a circular providing for an additional time of 60 days for recognition of loan accounts as sub standard. The GNPA without RBI dispensation stood at 3.7% and NNPA stood at 0.03%. The team across various functions continues with its collective effort towards coping with this challenging situation in the current fiscal year.

Customer Connect Initiatives
To hear and learn from customers about their needs and aspirations is always our first priority. This year, we conducted customer forum meetings across 4 regions at more than 400 branches month on month basis. We organized meetings and communicated about our products & services in order to expand the scope of services to our customers. These meetings gave us learning insights from customers and helped in modifying our approach and services accordingly.
Swagat Program
Swagat is the program launched to welcome Ujjivan’s existing borrowers to the fold of “Ujjivan Small Finance Bank through Opening of a Savings Bank Account for our existing borrowers which includes a personalized chip enabled debit card and a uniquely designed pouch made for customer convenience. Done with the help of a handheld device and an intention to enroll all our active borrowers before the launch of a branch, the campaign is completely paperless Aadhar enabled with biometric authentication
Insurance for Group Loans
Insurance for borrowers is  available up to the age of 59 years and for their spouse up to 58 years. Availing insurance product through Ujjivan Financial  Services is optional and is subject to sole discretion of customer/spouse.
Insurance for Individual Loans
· We advise all borrowers and co-borrowers to insure them
· Age of the customers must be between 18 and 57
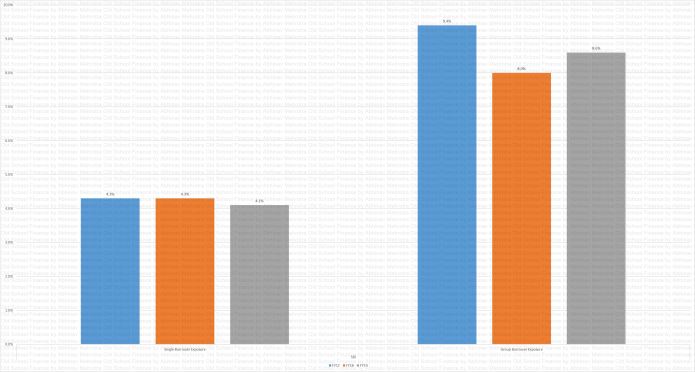
· Premium amount: Rs.4.09 per 1000 loan per person per year
· Sum assured is equal to loan amount
A lot of new loan products have been introduced this year. Refer to the excel sheet for more information.
Assessments:
Code of Conduct Assessment (COCA):
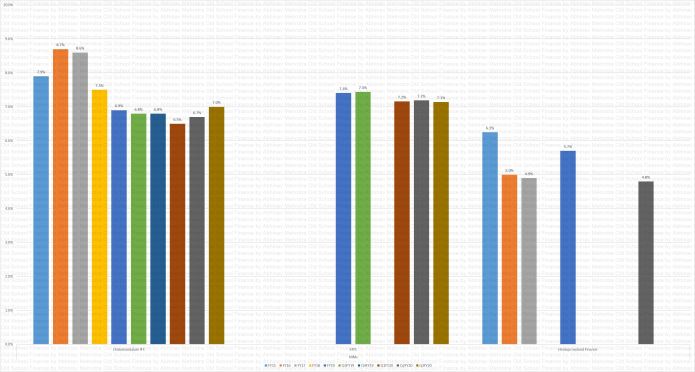
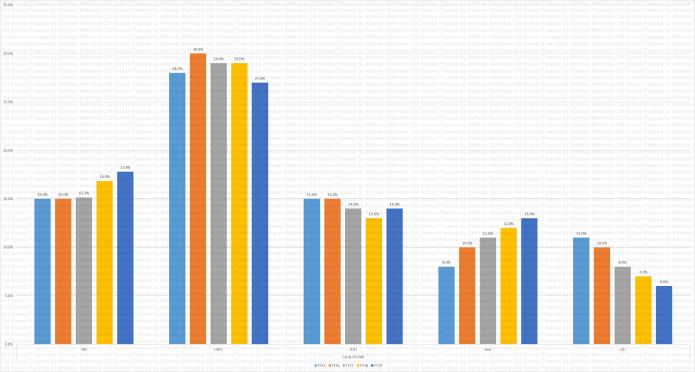
Ujjivan underwent the “Code of Conduct Compliance Assessment” during December 2016. The assessment was conducted by M2i Consulting, an independent agency, using COCA Compliance Assessment Tool. This tool requires scores to be assigned on the seven Code of Conduct dimensions – Client Origination, Loan Pricing, Loan Appraisal, Client Data Security, Staff Conduct, Client Relationship and Feedback and Integrating Social Values into Operations, across the four parameters – Approval, Documentation, Dissemination and Observance. The seven dimensions have been drawn from a review of the norms prescribed for MFIs including industry’s code of conduct, fair practices code of RBI and CGAP’s client protection principles (Smart Campaign). The COCA tool also specifically assesses the MFI for compliance against the RBI’s guidelines and scores it as well. The scores on the COCA indicators are then scaled down in proportion to the score received in Regulatory Compliance. Ujjivan has received composite COCA score of 93% (145.8 out of 157) on seven CoC dimensions and 100% (12 out of 12) scores on adherence to RBI directions which denotes “Excellent Adherence”.
Understanding the expectations of un-served and underserved customers from a bank
The unserved and underserved segment of the society generally perceives that the banking transactions are painful, unsafe, entail long waiting time in queues at bank branches and they also face lack of respectful treatment, difficulties in accessing their funds and poor assistance in filling forms or carrying out a transaction.
Due to these barriers, Ujjivan’s present customer base and large section of lower income group population don’t seek banking services for their day to day financial transactions. Ujjivan had assisted its customers to open savings accounts in other bank branches in the last few years. However, it was evident that these customers have not been actively using their bank accounts for the reasons mentioned above.
Therefore, our Service Quality programs focused on changing those perceptions towards banking, an assurance that ensures:
• Customers are treated respectfully irrespective of the size of their transactions
• Quick and hassle free services
• Doorstep services to ensure easy access and convenient banking
• Assisted services across channels for smooth banking transactions and ensure gradual shift from ‘assisted to self service’ model
Customer Relationship Management
Customer Care Representatives (CCR)
Enhancing skills from a Micro Finance role to a Bank Role: Over a period of 7 years we have developed a unique CCR program that provides abranch one representative who will focus on the needs of walk-in customers at the branch, their query and complaint resolution and on reducing customer dropout rates. One of the major achievements of the CCR project was achieving high customer retention rates through an exit interview process for dropout customers.
Preparing the existing CCRs for a Small Finance Bank was one of the key focus areas of Service Quality department during the year. The CCRs will now be placed at the welcome desk in ‘Bank Branches’ and specifically trained on attending customer needs and providing assistance in carrying out their transactions quickly. We have envisioned paper-less banking concept to make banking transactions effortless and quick. In case of any forms/ challans are still needed and customers are unsure of how to fill them, our CCRs and other staff at branches will assist them for the same. The training of CCRs are being completed through multiple phases including role based bank readiness training, technology and regulatory trainings. A variety of training methodologies are being used such as interactive sessions with group discussions, role plays using real life situations, practical technology sessions and e-learning projects.
CRM solution
Until now, a simple complaint tracker was used by Service Quality team to document, track and resolve customer enquiries and complaints. The complaint tool was not integrated with the core banking solution. Our new CRM software is capable of handling different types of customer support requirements such as service requests, deliverables management (debit cards, cheque books, statements of accounts), enquiry, complaints and feedback. The CRM solution enables auto assigning of service requests to concerned support functions and fulfillment teams, tracks resolution against prescribed turn-around-time and auto escalates pending requests. The system acknowledges receipt of requests or a complaint via text messages sent to customers and communicates the closure of the issues.
From a traditional Helpline to 24/7 Phone Banking Unit – multiple channels for customer support
We have migrated from a traditional 9 am – 5 pm helpdesk to 24/7 multilingual phone banking unit with an advanced contact centre technology. Our customers will not face hassles of IVR or robotic voice; their calls will be directly connected to dedicated officers based on preselected language preferences.
Risk Management
Ujjivan Financial services as a MFI had exposure to money market instruments through CPs in FY 2016-17 In addition to its traditional funding sources from Banks, NCDs and NBFC’s etc. As such the function of market risk was mainly restricted to ALM. Ujjivan had a unique process to evaluate and monitor risk at each of its branches. This included an assessment of both internal and external factors, including quality of credit portfolio, branch supervision, staff attrition and external events. A team of field risk staff complemented the efforts of the team at the corporate and regional offices to generate a risk score for the branches. Based on the risk scores generated, the branches that are deemed to be exposed to higher risks were subjected to greater monitoring and control and the frequency of audits at these branches was increased. It is this rigorous monitoring of risk at a granular level that had helped Ujjivan avert any major crisis that had affected the MFI sector from time to time.
In compliance with the requirement of Companies Act, 2013, Ujjivan completed in 2016-17, a review of its Internal Financial Control (IFC) based on the COSO framework. It is now in a state of preparedness for ISO 27001 certification and is implementing Business Continuity measures pursuant to the requirement of ISO 22301.
Our Culture
Ujjivan has a culture based on a set of core values of Integrity, Transparency, Respect, Professionalism and Teamwork tied together amidst diversity. We also practice an open door policy where employees are free to put across their ideas to foster transparency, fairness, integrity and innovation within the organization. Ujjivan believes in the purposeful involvement of employees at their workplace so that they can make a difference & give back to the community and make a positive impact.
Since inception, we have always believed in building a culture of trust in our processes & functions throughout the organization. As a result, we have grown together as an organization which is “Born of Trust” and are known for our service excellence. We have been able to achieve this by being a people-oriented organization.
Employee First
At Ujjivan, we believe in Employee Power & “Employees First” is our motto. We believe that happy employees create happy customers. Employees at Ujjivan feel cared for & valued. All employees here take a lot of pride in doing meaningful work & bettering lives. Ujjivan tops the chart in Customer Service & Customer Retention Ratios across the Banking & Financial Services Industry.
In this entire journey of transformation from microfinance to a Small Finance Bank we have ensured professional development is accorded the highest priority so that the employees feel valued and their skills are being nurtured to take over future roles within the organization. In alignment with the motto of ‘Employees First’, our Banking Services was first launched to our employees before it was opened up to our customers and the general public. While we transitioned into becoming a Bank, we always worked with the prerogative that new opportunities & roles will first be given to the existing employees before opening it up for external hiring & talent acquisition.
It is our constant endeavour to support our employees at all times of needs. One such momentous occasion came up as the country grappled with the aftermath of demonetization. With ATM’s unable to dispense cash and banks running out of money, we stepped in to support our employees and cash salary advances were extended to employees in addition to getting our partner banks to extend mobile ATM services to our staff in the offices. This well timed and well-meaning gesture helped our employees focus on supporting our customers well and focus on their work through the turbulent phase of the nation’s transformation.
MD&A
Business Growth
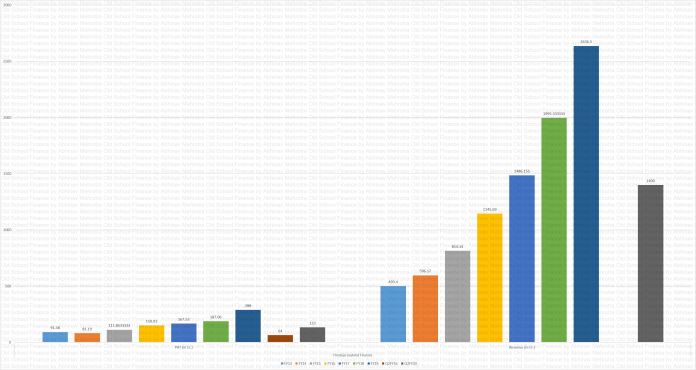
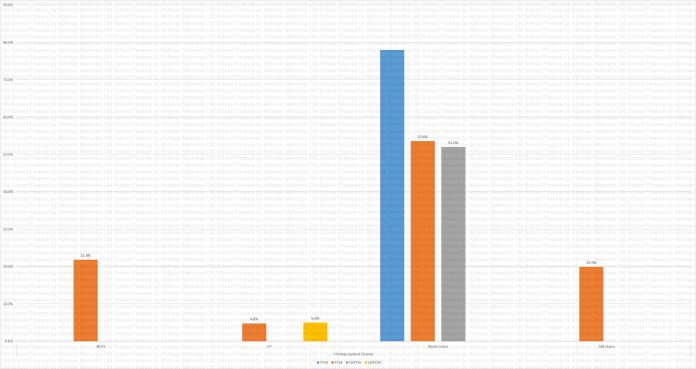
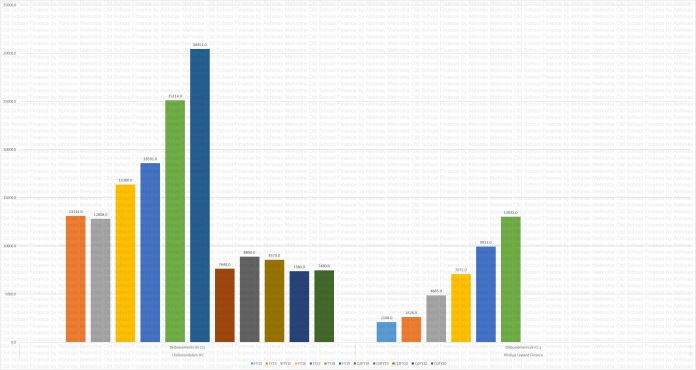
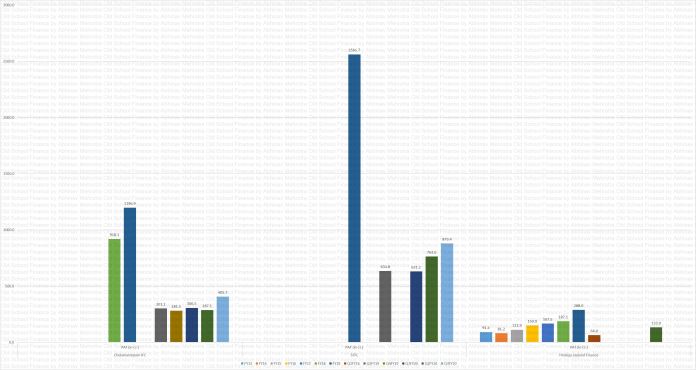
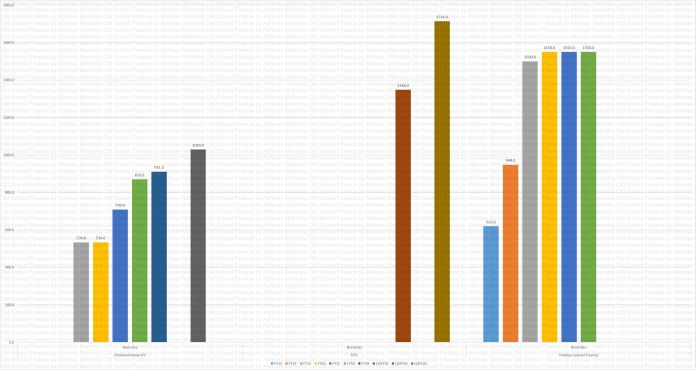
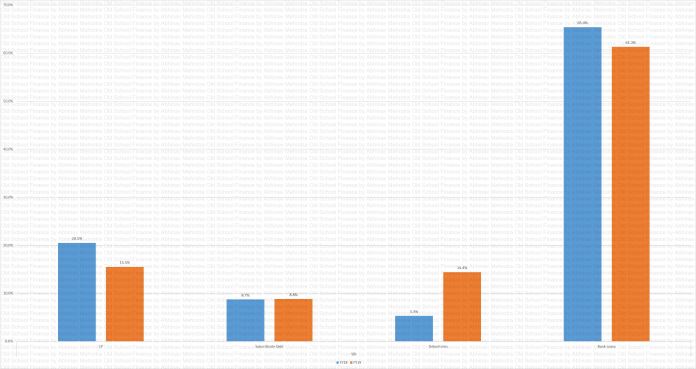
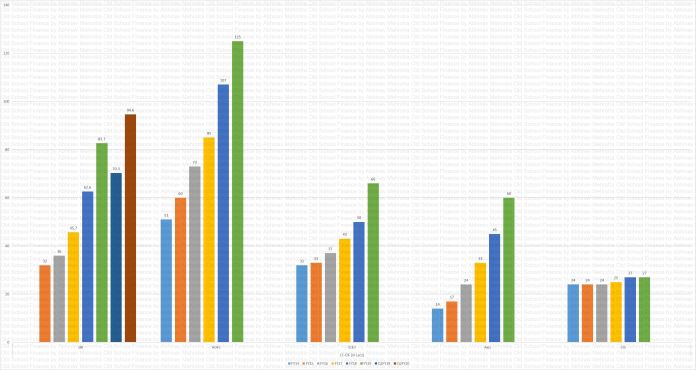
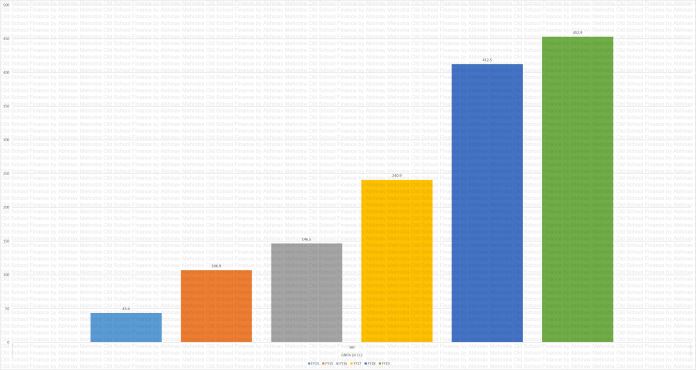
The strong growth momentum of the first half (59% growth in loan book over first half of PY) was impacted by demonetization which affected our business volumes and de-railed collection discipline, affecting our credit quality. Paucity of currency necessitated suspension of new customer acquisition for both group lending and individual lending business. We made cash disbursements to select repeat customers with good credit track record to smoothen their cash flows. In our first two months of operations as a Small Finance Bank, we garnered a deposit franchise of Rs.106.4 Crore including a retail franchise of Rs.6.6 Crore.
Funding
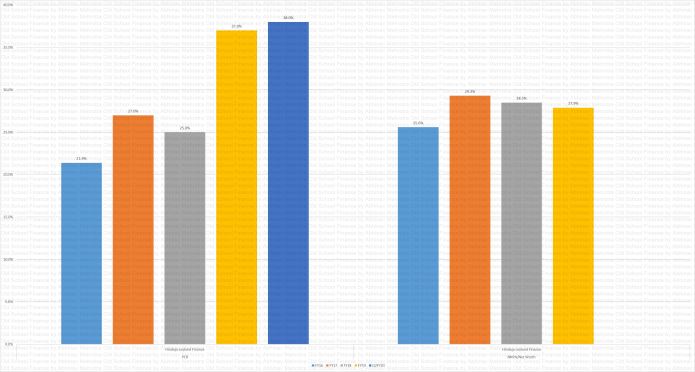
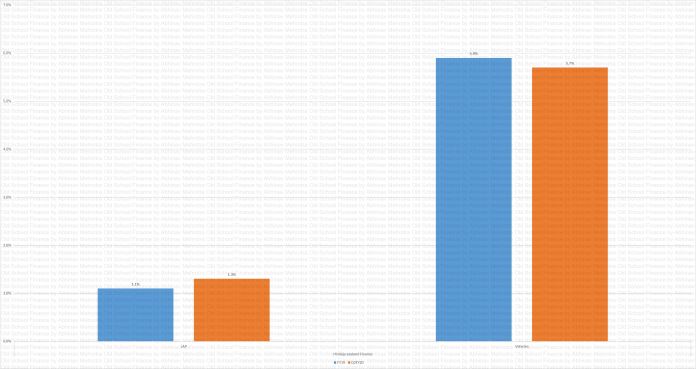
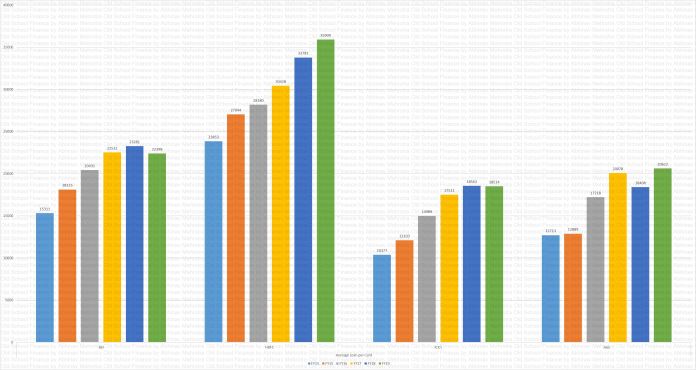
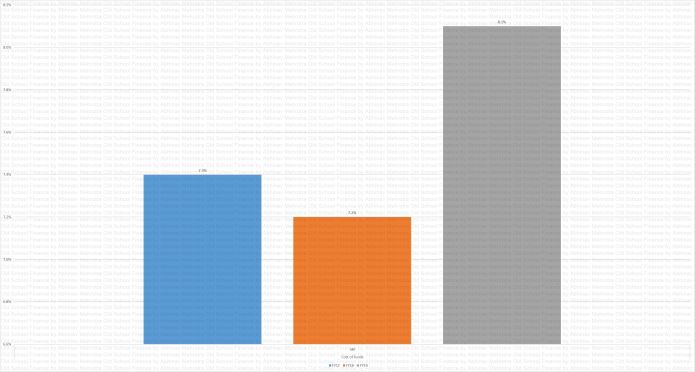
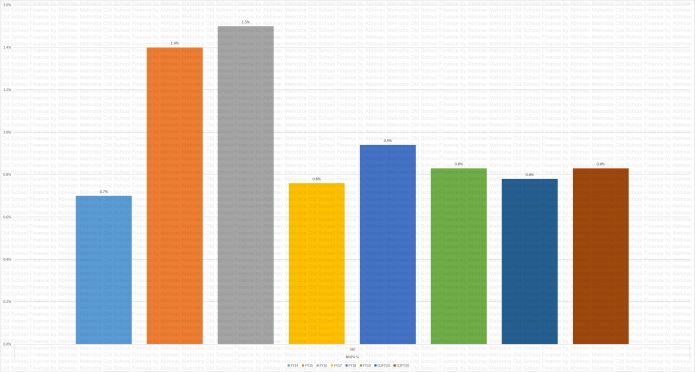
With increased capitalization levels on account of a successful IPO and better credit ratings, Ujjivan was able to raise funds at the most competitive rates. The average cost of debt and Marginal cost of debt saw a reduction by 1.6% and 1.4% respectively during the year, the benefits of which was passed on to our customers through reduced rates on our loan offerings. Interest rates on our GL and IL products were consequently reduced by 75 bps.
MF Business
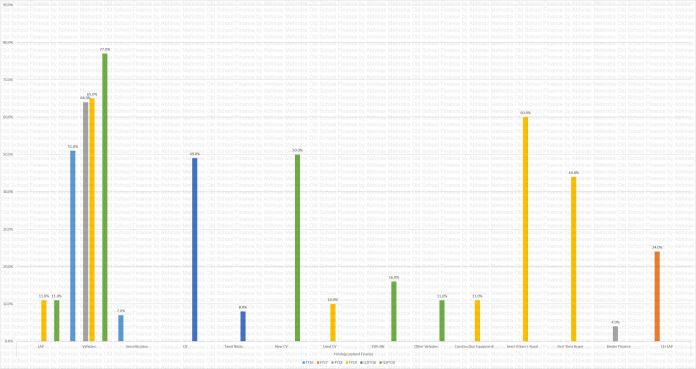
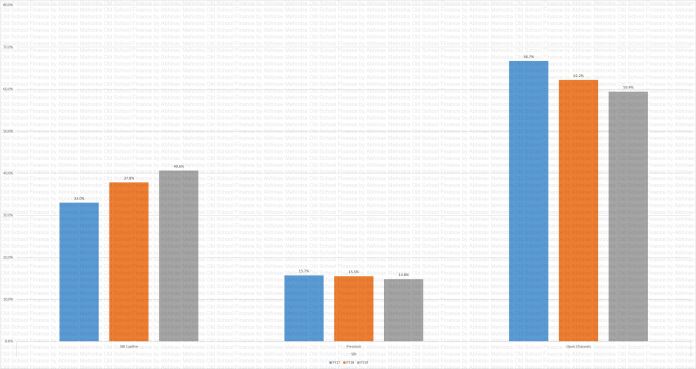
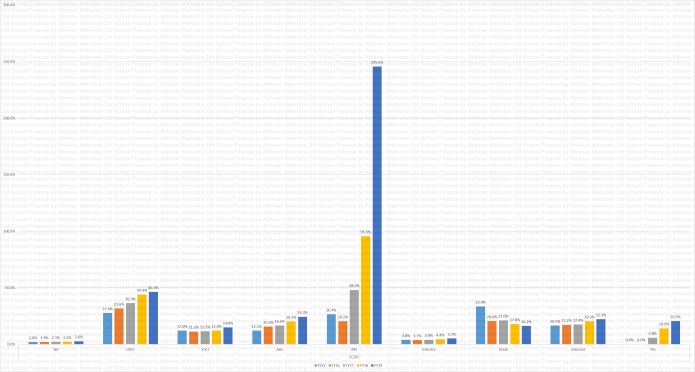
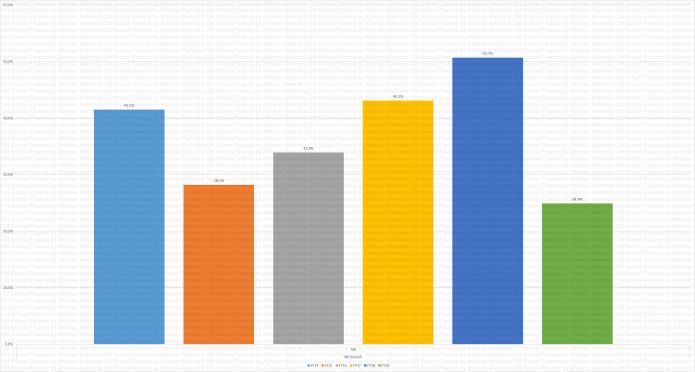
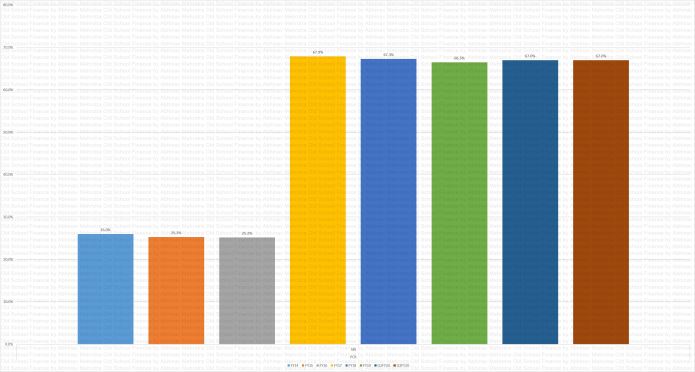
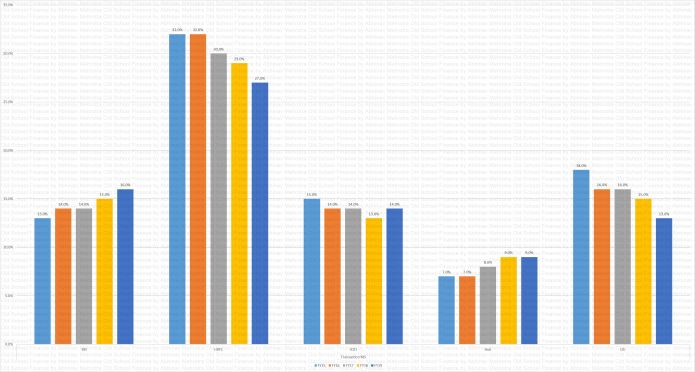
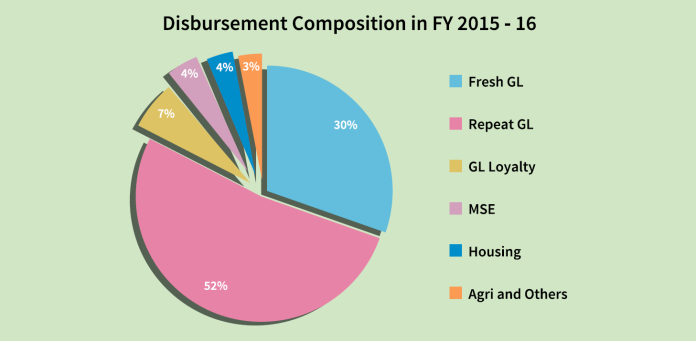
Loans to repeat customers constituted 71% of the business during the year while fresh business constituted 29%. New customer acquisition was expected to be moderate this year and lower than that in the PY primarily in view of focus on transition to banking. Fresh business had good traction up to the first half of this year with 10% growth over last year, slowing down in the next two quarters as demonetization affected our credit discipline and transition processes progressed in full steam. Fresh acquisitions was suspended during the demonetization period and significant support was offered to our customers during this time including disbursements in cash helping them smoothen their cash flows and we offered extended repayment timelines to enable them to acquire legal tender.
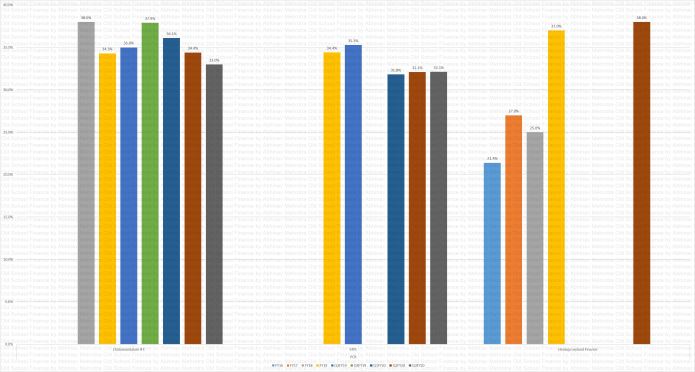
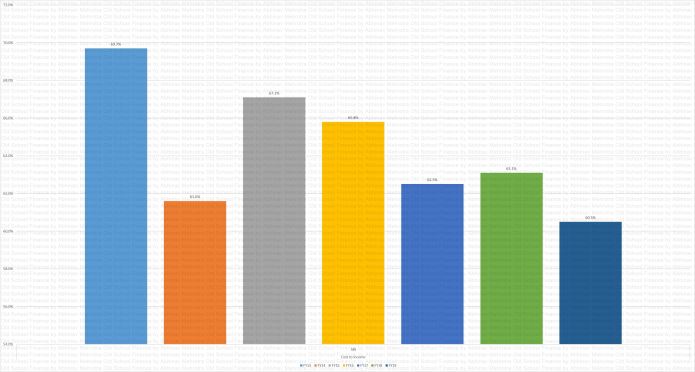
There was an increased focus on income generating loans during the year. 78% of the group loan book was for income generating purposes against 72% in the PY. Transition to an SFB has freed us from some of the regulatory restrictions on lending policies applicable to NBFC-MFIs. To ensure that customers are not over-leveraged on account of multiple institutions lending to them, we have retained the indebtedness cap at Rs.60,000 for branches with PAR >1% and raised the cap to Rs.100,000 for branches with PAR <1%.
Affordable Housing Business
The biggest challenge in the Affordable Housing space is the irregular or seasonal and largely undocumented income from informal sources. Ujjivan initiated its flexible “Assessed Income Program” to cater to customers in the informal segment in the semi urban and rural areas, assessing their income through minimal documentation – personal discussions, house visits and bringing them under the ambit of institutionalized lending. Our secured Housing business was affected due to a bearish real estate market as an aftermath of demonetization. Challenges in income flow and property valuation & construction due to uncertainty also affected volumes. Overall, the collections rate of the Housing vertical stood at 99%+.
MSE Business
The Unsecured MSE offering got good traction from our customers and contributed to 67% of the total MSE loan book. The Unsecured MSE offering got good traction from our customers and contributed to 67% of the total MSE loan book.
Paucity of currency necessitated reduction in business volumes. New customer acquisition for both group lending and individual lending business was suspended during the period and cash disbursements were made to select repeat customers with good credit track record to help smoothen their cash flows.
Risks
Major problems faced during the demonetization period were external interference influencing the borrowers against repaying and false complaints against field staff. Maharashtra, UP and Bengaluru faced overdue problems due to certain external forces trying to influence the customers and thus throwing a major challenge to the industry in particular. Vigilance team actively participated by way of meetings with local community leaders and government officials to thwart the negative influences. Concentrated efforts are underway to bring down the overdue numbers.
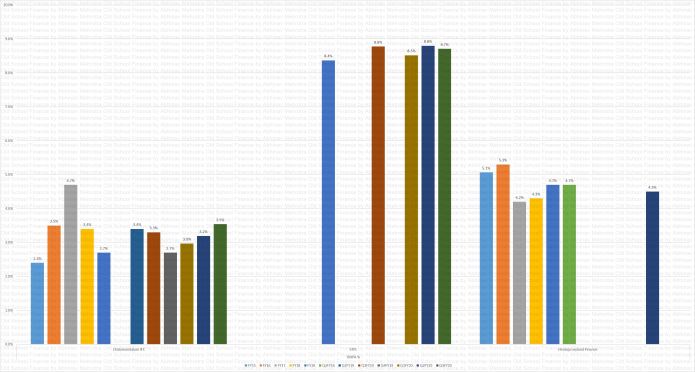
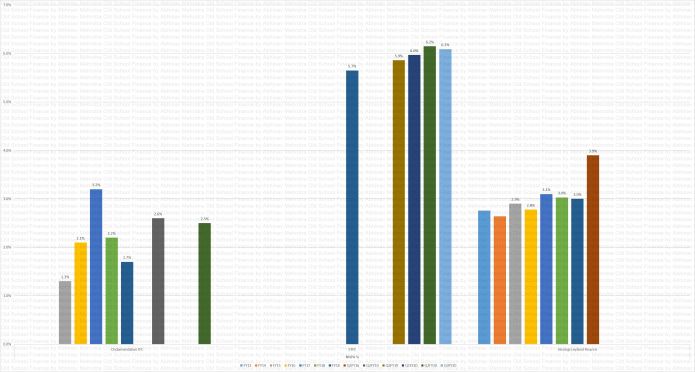
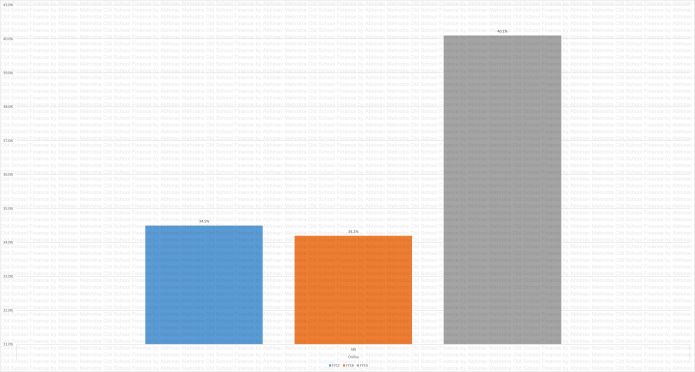
The first impact has been on the collections for the MFI Industry which dropped to 86% from its standard collection rate of around 99%. While banks were allowed to collect old notes, the NBFCs including NBFC-MFIs were not allowed to do so which led to higher level of defaults for NBFCs. Consequently the collection discipline was derailed resulting in higher PAR & Provisions during the year.
The RBI dispensation on classification of NPA (allowing a further 90 days over the 90 days overdue norm for classification as an NPA) was misconstrued and deemed as repayment holidays, adding woes to the already affected situation. This was further taken advantage of by local politicians in states of UP, Maharashtra, Uttarakhand and Karnataka. Our NPA levels saw an increase during the last two quarters due to local political interference and rumors of loan waiver disturbing the credit discipline among our customers affecting collections during the period.
Livelihoods of many of our customers across selective segments were impacted:
• The salaried segment received salaries in advance in old notes, their cash flows were badly impacted on account of this since these notes were not valid. Many factory employees lost their jobs.
• The micro and small enterprises faced a severe downturn in their business or were shut down on account of disruptions in the supply chain which is mostly cash driven. Income levels dropped all of a sudden which laid stress on their household cash flow management
• Similarly in Agriculture, the sales, transportation and distribution of agri produce to mandis/wholesale markets is dominantly cash driven and the cash crunch led to disruptions in supply chain impacting the sales volumes and increased wastage of perishables resulting in lower revenues and lower repayment capacity.
Since March 2017, there has been improvement in the customer’s ability to pay their installments, however, not all past due installments have been paid up. As a result, loan installments of such customers for the previous months are getting adjusted against the amount received. Due to this lag factor and until an account is normalized, there is a significant portfolio which will continue to be NPA during current financial year. Important point to note here is that the NPA is largely coming from states which have/are seeing errant political/ external interference misleading and forcing customers to default.
We offered extended repayment time for customers, continuing a healthy relationship with them during such testing times. Ujjivan pamphlets were distributed to all customers. We also ensured continued service to good customers by providing them with repeat loans. Loan rescheduling options have been provided selectively to borrowers in financial distress.
Customer Service
Quick and hassle free service with dignity, assisted services across service channels for seamless banking transactions, graduating to ‘self-service’ model are our mantra for customer service. Ujjivan is leveraging its IT infrastructure by using Aadhaar & NPCI’s range of services, E-KYC, E-Sign, AEPS, IMPS & Rupay to bring banking services to the underserved & unserved segment.
Provisions
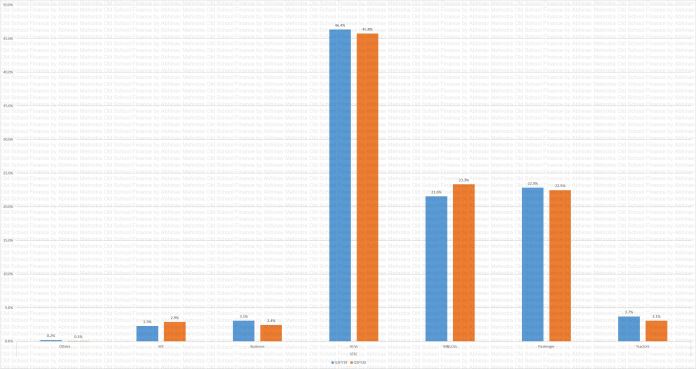
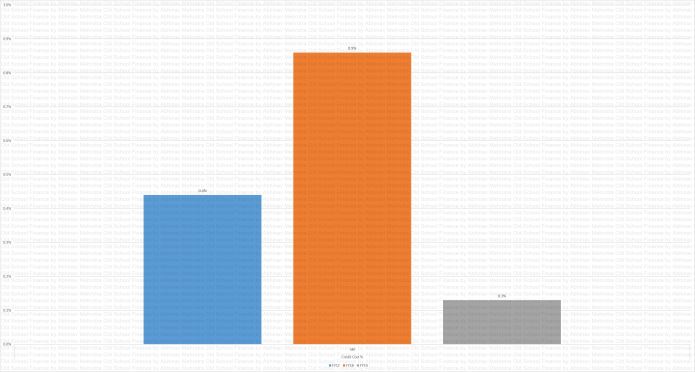
Overdues falling in November’16 and December’16 were named as “Special Mention Accounts (SMA) –  Demonetization” and classified as standard asset for 90 additional days (Up to 180 days) as per RBI dispensation.  Provisioning was made at 10% (Group loans) and for Individual loans at 20% across SMA-Demonetization over dues for affected states with <  90% collection efficiency. Existing standard asset provisioning norms of 0.65% on GL and 0.75% on IL for 180 days were adopted  across non-affected states with >90% collection efficiency on Nov’16 and Dec’16 Incremental Overdue accounts. Provisions were made on the monthly Incremental Overdues from Jan’17 onwards for the loan portfolio  under the existing provision norms. No deviation from the existing policy. Cumulative Provisions as of March: Rs. 125 Crore  on own assets.
Collateral Impact
Impact of Demonetization will spill over into the next financial year with increased credit costs. Ujjivan  shall follow a cautious approach towards business in the stressed clusters to contain the credit quality for the first two quarters  of the next year
Ujjivan Small Finance Bank
Letter from MD – Samit Ghosh
The danger pointed out by Professor Yunus is that if the same rules & regulations governing regular commercial banks are applied to Small Finance Banks (SFB), sooner or later these institutions will end up becoming banks in the same mould and SFB’s will lose out on the special purpose they are set up for i.e. Financial Inclusion. We are already seeing this unfold as we try and comply with a host of regulatory & compliance requirements. For example, the much awaited RBI’s new ‘Branch Authorization Scheme’ is a radical new direction of moving away from the traditional brick & mortar branches to the concept of ‘banking outlet’, yet it has to navigate through the path of the Banking Regulation Act. In order to succeed, it is imperative that the SFB’s and the regulators work together to craft a specialized set of rules & regulations, as it did in the past for NBFC-MFI institutions. He also added that Ujjivan Small Finance Bank is entering unchartered territory which will have its own set of challenges, but the organization needs to retain its culture, ethos and always reminisce that Ujjivan Small Finance Bank is a mission driven bank.
The five key challenges which are ahead of us this year are:
Portfolio Quality
Demonetization has possibly brought in significant benefits to the country in its battle against ‘black money’ and unaccounted wealth. However, for the entire microfinance industry where customers primarily operate in the unorganized sector and cash transactions are the main medium of exchange, it has been a major disruptor. The problem was exacerbated by local politicians who utilized this opportunity to raise the bogey of ‘loan waivers’ to give false promises to customers and destroy the financial discipline in a number of pockets. The redeeming feature is that unlike the Andhra Crisis, the RBI, State & Central Governments including local administration have largely been supportive of the microfinance institutions (MFI’s) and against loan waivers. The problem was initially complicated by allowing banks to collect repayments in demonetized notes in the first two months, but not permitting finance companies including MFI’s to do the same. Most customers could not understand this distinction and were confused. The poor portfolio quality was not impacted evenly across the country and surfaced in some major pockets. This could have been due to aggressive lending in the past two years by certain MFI’s in those areas. The impact was also felt in areas where livelihood was seriously impacted for micro-entrepreneurs and salaried individuals in the unorganized sector.
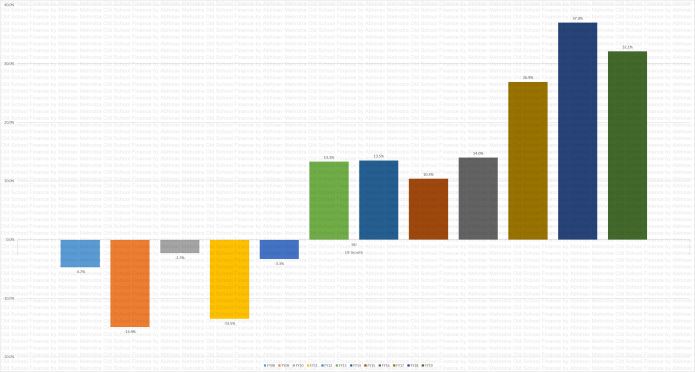
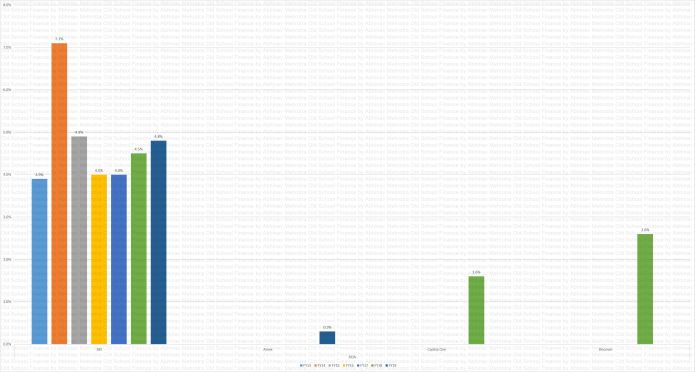
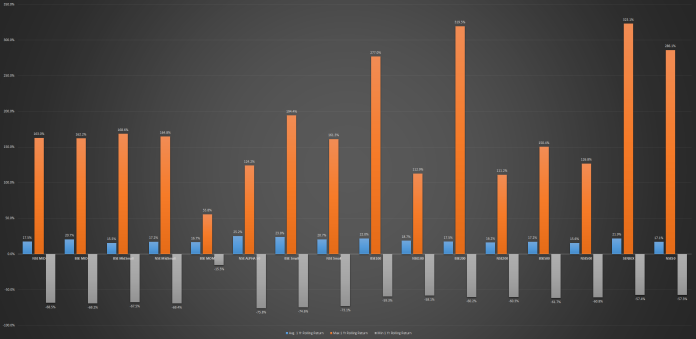
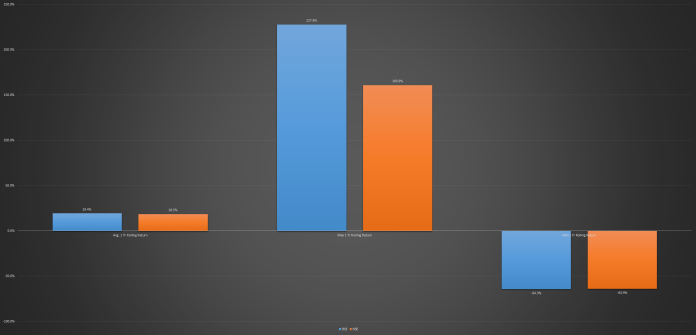
The MFI industry faced Portfolio at Risk (PAR) ranging from 5% – 20% compared to around 1% prior to demonetization. The RBI provided some relaxation in categorization of non-performing assets & provisioning for those assets which deteriorated during November & December. However, in the current financial year the industry will feel the full impact of the credit cost, which will be significant. Customers are slowly starting to repay the over dues but with a lag effect of 2-4 months and for some of the customers there has been a temporary impairment of livelihood. Further a section of customers who have turned delinquent are new to micro finance, being less than two years old in the system and hence less disciplined. A portion of these over dues is likely to be written-off but it is difficult to estimate at this moment.
In Ujjivan, we have categorized branches with high defaults as affected branches and at these branches the sole focus is on collection. We have seen a positive turnaround from March though the progress has been slow. We have put in place a number of collection programs to arrest the deterioration & start collection from higher buckets. Customers are also being re-assured that they would get repeat loans if they regularize the present loans. We are also taking measures of curtailing our exposure in locations where the credit discipline has totally broken down. Ujjivan is in the middle of the spectrum in terms of impact on the portfolio quality. We expect that it will take us few months to bring back the portfolio quality to normal.
Rolling Out Ujjivan Small Finance Bank Across the Country
We decided to roll out our branches in phases for a number of reasons. Our branches have been designed based on customer research and their needs. We also intended to have maximum impact of our new brand identity on the customers, which has been very well received. Despite all the preparation in our infrastructure, channels & technology, there are bound to be teething issues in the first six months.
The phased roll-out of branches is helping us gather operational learnings; we are able to access how do we improve our delivery skills and manage our costs. RBI’s long awaited ‘Branch Authorization Policy Guidelines’ was issued on May 18, 2017. This year we plan to convert around 150+ branches.
Building the Liability Business
One of the observations of Vijay Mahajan during the launch of the Bank was that generating liabilities by competing with existing banks was one the most challenging areas in his experience of managing the Local Area Bank for fourteen areas. Our initial plan is to focus on wholesale liabilities. In order to achieve this effectively, we need to get the ‘Scheduled Bank’ status. The RBI inspection has been completed and our expectation is that we should receive the Scheduled Bank status shortly. This will considerably ease the process of raising bulk deposits from institutions which will not only help us in
funding but will also lower the cost of funds.
Secondly, our focus is opening accounts of our existing microfinance customers and disbursing our loans into these accounts. This process is on and is being undertaken in a phased manner for customers of the SFB branches. Parallelly, the retail liability from open market customers has commenced. Our goal is to attract the underserved customers who keep their savings outside the banking system. This is totally uncharted territory and we are progressing slowly based on research and new offerings to specific customer segments.
Building the Asset Business and our Portfolio Growth
Post demonetization, our portfolio growth was impacted. We had restricted loan disbursals in affected branches. New customer acquisition was discontinued at these branches and only repeat loans to existing customers were permitted. However, the unaffected branches continued with business as usual. From March closer to pre-demonetization, we have seen overall disbursal of loans closer to pre-demonetization levels.
This year, our overall focus would be moderate growth in the microfinance portfolio and higher levels of growth in the micro and small enterprise business & affordable housing business; though these have currently very small bases. We are also exploring new loans products like personal loans to the underserved segments of customers.
We will also be looking at reviewing our microfinance business both in terms of process & products. This is for two reasons. Firstly, the impact of lower collections deteriorating our credit quality in a few pockets will require us to review and re-assess our existing processes in future. Secondly, we would be free from a number of restrictions as a SFB and we need to leverage this flexibility in our product offering.
Managing our Costs & Productivity
It was expected that our costs would increase significantly with our investments made in technology, channels, infrastructure, marketing, regulatory compliance and people in our transformation to an a Small Finance Bank. However there were unexpected impacts post November. of lower portfolio growth and lower collection efficiencies; therefore there is an additional impact of significant credit cost in terms of credit provisions and write-offs and higher operating expense ratios. All this requires us to bring in special focus on managing our costs & productivity. We will also take advantage of the three years given to us by RBI to convert all our branches to full service SFB branches. By the end of FY 2017-2018, we plan to have approximately 150+ Bank branches,. Our phased network expansion will be cost optimal and help us effectively apply our learning from our experience to the new and existing branches.
To conclude, this year is going to be extremely challenging. We are confident that we have requisite strategies & teams in place to overcome these challenges. Our profitability may be under constraints, But we will build a successful Small Finance Bank through this baptism of fire.

The long awaited RBI’s ‘Branch Authorization Policy Guidelines’ was issued on May 18th, 2017. This policy puts a lot of focus on Branchless Banking. The idea of Branch Banking has been replaced with a new concept called “Banking Outlet”. It acknowledges the power of technology and alternate channels like BCs etc to reach out to the unserved & underserved areas. Accordingly we have decided on a phased approach. We plan to open new branches in Unbanked Rural Centres to meet the regulatory requirement of having 25% branches in such locations. Our preliminary research and early experience suggests that such locations have significant banking business potential and the right business model for these branches will help us build robust business at such locations.
The new guidelines also gives us the benefit of considering our branches in the Left Wing Extreme Districts and North Eastern States plus Sikkim as our Unbanked Rural Centre branches. We have 19 of our existing branches in such locations, which will help us in optimizing Unbanked Rural Center branches in first year.
Technology Readiness
Technology is a key enabler for the viability of Small Finance Banks. As we plan to work with un-served & underserved segment of customers where nature of transactions will be high volume-low value,, we have developed a technology platform which leverages Ujjivan’s existing system and integrates with Aadhar & NPCI platforms and have invested in proven systems like Finacle, SaS, i-Exceed etc. We have tied up with Wipro as system integrator. Our data centre is outsourced to IBM to ensure maximum uptime and highest level of security. Our field processes are designed to provide doorstep & hassle free service, therefore mobility is the key to our technology. Handheld devices, paperless account opening and Biometric ATM are some of our key differentiator compared to the regular banks.
Looking Ahead
Looking ahead, as more branches go ‘Live’ with the full set of banking services, the Ujjivan experience will soon be available nationwide. In the next few months, 10 SFBs and 8 payment banks will join the banking industry. It will disrupt the industry and customers will have additional options to choose from. Each of these new entrant will have their own focus area and it will be quite interesting to see how the industry unfolds in the coming years. Given the size of unregulated shadow banking, there is a huge potential to bring those customers to regular banking system. As banking services reaches to unserved & underserved segments and area, we will see a lot of new customers entering banking system in true sense. Ujjivan is ready to reap the benefit of the changing banking industry.
It is important to acknowledge that each of our customer has their own expectations from a bank. To be successful, we must cater to the needs of our customers. Leveraging the technology stack and combining it with our significant on ground presence, Ujjivan can make a difference in the financial services industry. In the next 5 years we see ourselves as a leading mass market bank.
Brand Identity
The illustrative form is therefore a combination of two visual icons – a blooming flower and a bird set to take flight. The flower in bloom is a metaphor for welcoming (swagat, in our culture) and growth – as we welcome our existing loyal customers and future patrons into the banking fold. The bird symbolizes economic freedom and the aspiration to live your dreams, free from any discrimination financial or otherwise. When combined, it beautifully represents a powerful human centric brand identity that celebrates Ujjivan’s deep rooted societal connect and continual impact on building better lives for the millions of our customers.
SFB Products
Liabilities: Four savings, two current account variants along with two Term Deposit products were designed.
Savings Account Products: There is no entry barrier for the Savings Account i.e. there is no requirement for maintenance of minimum balance along with a host of facilities provided like Aadhaar enabled KYC using biometric authentication for paperless account opening, Rupay debit card and transactions at multiple access points like the Branch, Bank Meetings, ATMs, Mobile Banking, Internet Banking and Phone Banking. One regular and another for minors, two BSBDA accounts with 1 year validity for those without KYC documentation.
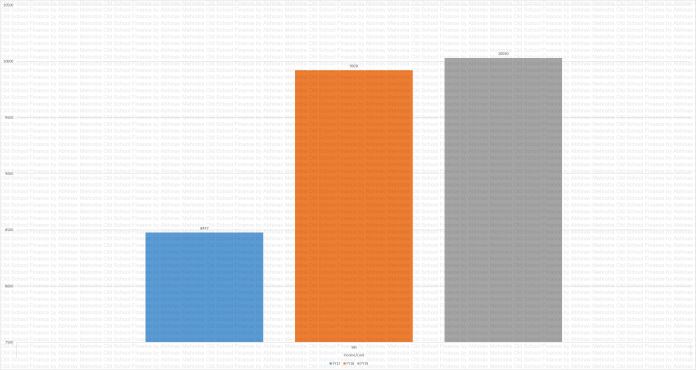
Current Accounts: 1000 rs. initial deposit, one with 5000 rs AMB and another with 10000 rs.
Deposits: Fixed Deposits and Recurring Deposits start with as low Rs. 1000 and Rs. 100 respectively with a premature and partial withdrawal facility without penalties to give the customers higher liquidity options. Option to opt for interest payment at monthly, quarterly, half-yearly or yearly frequency, Can be opened through Internet and Mobile banking, No penalty if deposit is fully or partially closed after 6 months.
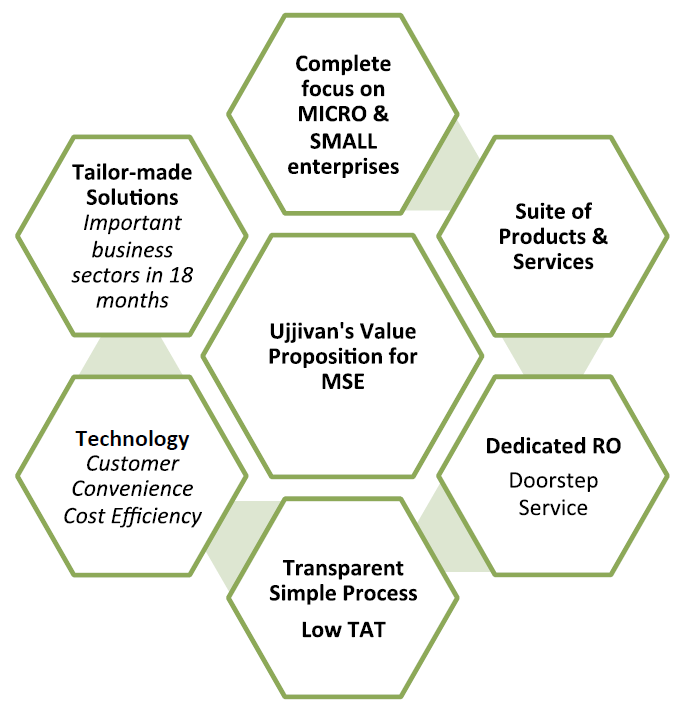
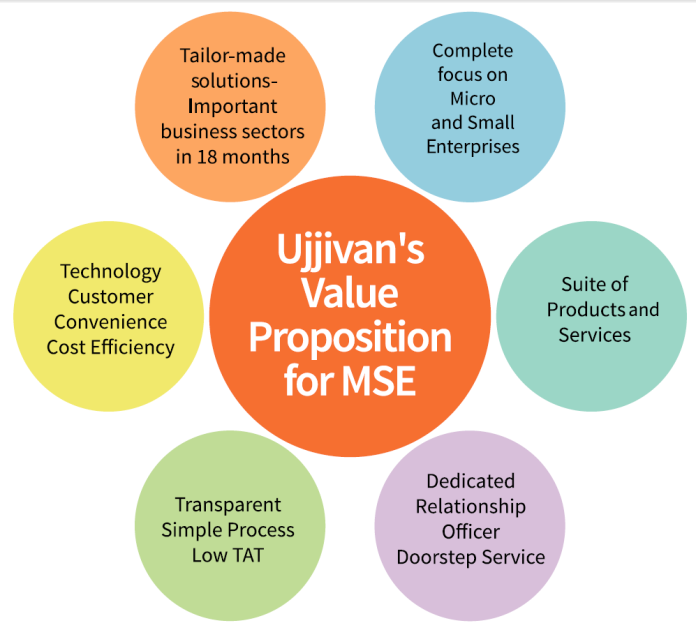
MSE
MSEs face a lot of issues in accessing institutional finance and continue to be dependent on sources such as moneylenders, pawn brokers, chits/committees apart from family and friends. It has been acknowledged that lack of institutional finance has stunted the growth of MSE for decades. Therefore, the Reserve Bank of India has mandated the aspirants of Small Finance Bank to focus on MSE as one of the main customer segments.
Additionally, Government of India has set up a dedicated refinancing agency MUDRA (Micro Units Development and Refinance Agency Limited) to facilitate flow of funds to this segment of customers. The unmet financial needs of MSEs offer a great opportunity for banks and NBFCs to develop a strong business line dedicated to this particular sector. However, the banks have not been able to do much due to various structural issues and NBFCs have not been able to provide a complete product suite, apart from term loans. Ujjivan has recognized MSE as its main target segment in line with its mission and also for product diversification and future growth. As a part of MSE Business, since August 2016, we have launched 4 new products across 40+ branches and through these, Ujjivan Financial Services has financed over 2200+ micro and small enterprises and disbursed approximately 56 Crore since the program was launched. This was achieved by inducting new customers from the open market. Since inception, the primary focus has been on open market sourcing.
The Way Forward: A dedicated MSE finance unit has been set up to cater to the needs of the segment. The unit will understand the needs of the customers, the business environment including competition and the risks and mitigations in order to bring out products and services for the micro and small enterprises. The products and services are being kept simple with high technology support in order to ensure fast delivery, quality underwriting and superior customer experience while maintaining efficiency.
The following products will be on offer in the course of current financial year:
• Secured Overdraft
• CGTMSE Term Loans
Screenshot 2018-04-20 17.58.43.png
Additionally, the facilities of Current Account, Remittance and Payments, Insurance, Savings and Investment will be offered to both our existing and potential customers. The use of technology will be instrumental in delivering superior customer experience by bringing efficiency in origination and management of loans. Further, technology will increase the reach and profitability of the MSE business vertical by making available reports and MIS. Better customer segmentation, predictive analysis to facilitate target marketing; and credit decision as well as portfolio management will also become possible. MSE Finance will be Ujjivan’s growth engine during the current year and also in the years to come.
Liability Sourcing
In the retail space, the focus is on mass market with specific attention to unserved and the underserved. Products have been designed in such a way that they are simple to understand and are delivered in a user friendly manner leveraging state of the art technology.
Few highlights of our offerings on the deposits side are
1. Use of handheld device to open accounts at customer’s doorstep and at the same time reducing the account opening TAT drastically
2. Implementation of CRM solution to give customer a seamless and unified experience across channels at every, starting from acquisition
3. Product design that addresses key concerns of customers
4. Non IVR call center to give customers a personal & human touch
5. Branch design philosophy flows from the aspirations and at the same time addresses the apprehensions of the target customer segments.
6. Biometric ATMs
All our existing loan customers are being on boarded into the liabilities banking relationship through an integrated program involving financial literacy, assisted banking and account opening through a simplified process. New customers will be acquired through a specialized team operating out of the bank branches. The approach involves identifying customer sub-segments through catchment mapping. This is used as an input for designing and implementing communication to reach out to each sub-segment. Use of Customer Relationship Management Solution enables tracking of each lead till fulfillment stage .Hand held device in an Aadhaar enabled environment results in customer account being activated in a fraction of time compared to what it would have been otherwise.
A large segment in the liabilities space is the institutions. This covers large government, semi-government and non-government entities. This space in terms of deposits size and potential in the universe of deposits is as large as the retail space. The approach here is completely different from that in the retail space. Customer connect and servicing for institutional customers is managed by a small team of
specialized and trained relationship managers. Institutional business is the source of large deposits which allows us to focus on building pure retail franchise in a systematic manner.
The focus is on identification of institutions and work closely with decision makers to get the bank empaneled, so that we can participate in the deposits requirement of the institutions in a mutually beneficial manner. Relationship managers are mapped to institutions to ensure continuity and build ability to spot opportunities to deepen the relationship. Within the institutional space, the specialized set of financial institutions including banks, insurance companies, mutual funds and others is serviced by FIG (Financial Institutions Groups) team which is part of treasury.
Channels
Channels is one of the start-up units that was set up in preparation for transition to a Small Finance Bank. These channels are intended to change the way the un-served and the under-served accessed banking services, build the basic banking habits to facilitate financial inclusion and to reduce costs as the business scales. The goal is to integrate people and technology to deliver unique segment specific solutions. These solutions delivered, will demystify banking and provide convenience through a continuum of options ensuring customers work their way up in the value chain. Customers expected doorstep banking which was communicated to us; consequently we set out to find solutions and the evolution from ‘assisted to self-service’ was the mantra to create value for all.
Today we deliver services through strategically launched multi-channel networks. This mix which includes branches, hand held devices delivering doorstep services, ATMs, debit cards, internet banking, mobile banking and phone banking has converted the Micro Finance delivery framework to full service bank delivery capability We also operate an in house phone banking unit which caters to service level queries. Our customers will not face hassles of IVR or robotic voice; their calls will be directly connected to dedicated officers based on preselected language preferences.
We are continuously improving and evolving our direct banking channels (branch and hand held devices) to enrich the digital banking experience for customers and enable them to make an easy and gradual shift from the assisted mode to the self-service mode. With this infrastructure in place, we facilitate product sales through these alternative channels. These innovative delivery channels are the key to a more efficient payment system and supported by a focused financial literacy drive for customers these options are transformative in nature. We have moved closer to offering financial services “anytime, anywhere” for the segments we serve.
The industry holds immense potential and the success strategy lies in our solution architecture being adaptable, scalable, secure and easily accessible for our customers who will become more financially astute in their banking habits.
MD&A
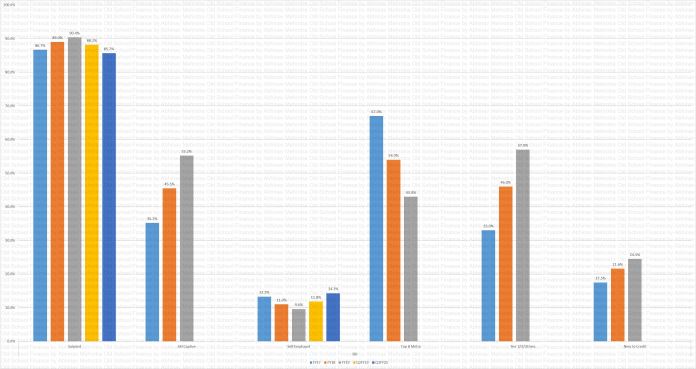
The regulatory norms mandate a focus on small ticket lending in the financially excluded segments by necessitating loans below Rs.25 Lakh to form at least 50% of the overall loan book. While products offered would vary, the focus customer segment of the SFB operating model would be the economically active urban and rural poor and small self-employed customers.
The government has taken several initiatives to boost the growth of Affordable Housing segment, including the ‘Housing for All by 2022’ scheme and the Interest Subsidy Scheme under the Pradhan Mantri Awas Yojana (PMAY). The MSE segment has also received a major stimulus through the Pradhan Mantri MUDRA Yojana.
Asset base diversification to individual MSE and affordable housing loans would expand the business potential in these segments and balance growth across various segments for the microfinance industry thus making the business model more robust.
Scaling up our deposit business will be a major focus area for this year. We shall follow a three pronged strategy for building our liability business. The first priority shall be sourcing higher ticket institutional/corporate deposits to rapidly scale up our deposit franchise and repay our high cost grandfathered loans, reducing overall cost of funds. The second priority is garnering deposits from our existing customers by offering them a bouquet of liability products. Our third focus will be on open market customers especially the un-served and the underserved who are essentially outside the formal banking system. Our products design is simple and easy to understand thereby enabling active participation by customers in these segments in the use of banking services. Paperless account opening, Biometric ATMs and access of bank account in center meeting using handheld devices are some of our key offerings, leveraging technology for faster delivery.
SFB – The Way Forward
The Small Finance Banks will be formidable incumbents, each with 5-10 years of track record of running viable and successful enterprises. Together they have combined loan book size exceeding Rs. 25,000 Crore and serve over 11 million customers across the country. The onboarding of these institutions into specialized banking will augur well for financial inclusion in the un-banked and under-served segments. The advent of fintech has caused a major disruption with technological innovations benefitting the customer ecosystem with new payment technologies, including multi-channel payment solutions, lower processing costs, lower turnaround times. The SFBs will have to leverage technological innovation in tandem with their wide outreach for efficient delivery to the last mile. Ujjivan has already set out on its mission to be the best institution to provide financial services to the un-served and underserved customers and transform to a bank serving the mass market.
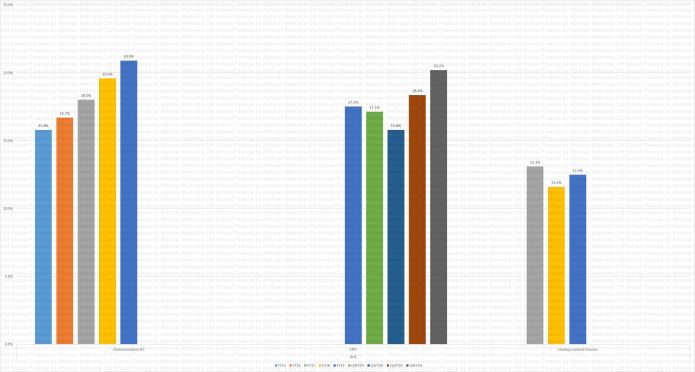
In terms of the operating guidelines issued by the Reserve Bank of India (RBI) for Small Finance Banks (SFBs), all SFBs are required to follow the Basel II Standardized  Approach for Credit Risk. Guidelines with regard to capital charge by SFBs for Operations Risk and Market Risk are awaited from  RBI. As per the capital adequacy framework, SFBs are required to maintain a minimum capital adequacy of 15  per cent of their Risk Weighted Assets (RWA). USFB has, in computing its capital adequacy, applied the more stringent  principles applicable to Basel III and as stipulated by RBI in its Master Circular RBI/2015-16/58 DBR.No.BP.BC.1/21.06.201/2015-16 dated 1st July  2015. However, for its mandatory disclosures in the Balance Sheet as at 31.3.2017, the Bank has provided for capital  computation under both Basel II and Basel III.
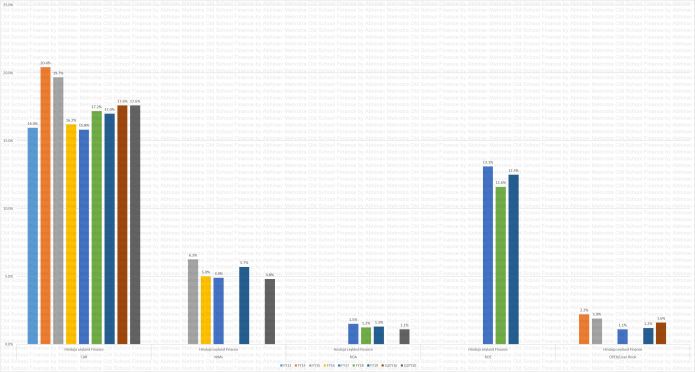
Based on RBI guidelines on capital adequacy, the CRAR of the Bank as on March 31, 2017 using the  Basel III principles and including capital charge for both Operational Risk and Market Risk was 18.24% against the minimum regulatory  requirement of 15%. When the RBI guidelines applicable to Basel II framework are applied, the Bank had a capital adequacy of  19.53%.The Bank is therefore well capitalised.
Credit Risk Management
The Unsecured Credit function specifically manages and monitors the microfinance business (JLG) and  Individual Loans through an independent loan underwriting and approval process. Credit risk monitoring for the unsecured lending  portfolio is undertaken in the following way:
• Field credit teams ensure implementation of various policies and processes through random customer  visits and assessment, training of branch staff on application errors, liaison with other institutions to obtain necessary  information/loan closure documents, as the case may be, and highlight early warning signals and industry developments  enabling pro-active field risk management. The efforts of the field credit team are supplemented by that of the strong Internal  Audit framework of the Bank. This is primarily audit of field and branch banking processes, including the credit  sanction and disbursement process. Any breach is highlighted and corrective measures initiated;
• Branch specific credit limits for JLG business have been formulated that define credit limits for various  occupations thereby addressing exposure and concentration risks. The limits so drawn ensure approvals in accordance with  customer’s maturity in the lending system, vintage with USFB, primary occupation of the family and their locale. The entire  policy suite thus enables robust customer selection and assessment;
• Portfolio analysis and reporting is used to identify and manage credit quality and concentration risks.  Monthly branch credit performance score cards have been implemented to ascertain the health of the branch portfolio.  These score cards capture critical portfolio quality parameters such as loan application error rates, arrears, collections and  write offs. The lending limits for branches are adjusted based on these scores.
Credit risk monitoring for the Bank for MSE and the affordable housing sector is broadly done at two levels  – account level and portfolio level. Account monitoring aims to identify weak accounts at an incipient stage to facilitate  corrective action. Portfolio monitoring aims towards managing risk concentration in the portfolio as well as identifying stress in  certain occupations, markets and states.
The Bank has also established an Early Warning System (EWS) to identify and act on signs of early  sickness in the loan accounts and take necessary corrective action. Such accounts, where potential distress has been identified, are  included and maintained in a watch list and reviewed on a periodic basis by the business and underwriting units so that suitable steps  can be taken for mitigation of risk. The Bank also actively monitors its credit portfolio on non-stress related factors, such as  concentration risk and program limits.
Special Mention Accounts
A system of early recognition with timely and adequate intervention forms the focus of the approach in  dealing with slippage of NPAs. In this context, the RBI has suggested introduction of an asset category between ‘standard’ and  ‘sub-standard’ for internal monitoring and follow up. This asset category is known as ‘Special Mention Accounts (SMA). The SMA has  potential weakness and hence deserves close management attention which can be resolved through timely remedial action. If left  uncorrected, the potential weaknesses in the said asset may result in deterioration in the asset classification.
In conformity with the prudential norms of the RBI, and its Board approved policy, the Bank makes  provisions on its Special Mention Accounts. The provisioning norms are applied on a time bucket basis. Time bucket is determined from  the date the account becomes overdue.
Classification of Non-Performing Assets (NPA) and Provisions on Loans
The Bank classifies its advances into performing and non-performing asset in accordance with the extant  RBI guidelines and its Board approved policies. The Bank makes general provisions on all standard advances based on the  rates approved by its Board. The provision on standard asset is not reckoned with for arriving at net NPAs and is not netted off from  gross advance. Specific loan loss provisions in respect of non-performing advances are made based on management’s  assessment of the microfinance business (JLG), Individual loans and MSE and the affordable housing sector subject to the minimum  provisioning level prescribed by the RBI.
Credit Risk Mitigation- Disclosures for Standardized Approaches
Credit function has a certification process for all business and credit staff involved in the field level  customer assessment for all its asset products. This training is also used to delegate role based credit approval authority to the credit  team at regional and central level. A well-defined approval and deviation matrix authorizes personnel in the hierarchy to approve loans  categorized on various risk elements.
The JLG and Individual Loan portfolio of the Bank is unsecured. Loans to the affordable housing segment  are collateralized by a mortgage over the property financed. The Bank is in the process of developing a score card model which  would facilitate operational decision making. There is a Credit Approval committee comprising senior officials of the Bank which  sanctions only the credit proposals above Rs 20 lakh.
Credit Risk Mitigant
Credit risk mitigation refers to the use of methods to reduce the risk of lending to a borrower. The Bank  has put in place a detailed credit appraisal process which is captured in separate product manuals and product programs. The  mitigants used in the unsecured lending portfolio are as follows:
• Life insurance is mandatory for all the borrowers in the JLG segment.
• Bank works with 4 credit bureaus and ensures 100% application screening through the bureaus. State  of the art paperless approval process, through the document management system enables a quick and uniform approval  process.
• Customers with emerging credit problems are identified at an early stage through the tele-calling team  and classified accordingly. Remedial actions are implemented promptly to minimize the potential loss to the company.
• A robust process for end use monitoring of funds post disbursement.
• An effective use of the centre meeting platform for its JLG portfolio to determine incipient problems and  introduce risk mitigants as appropriate.
The Bank currently holds physical collateral for credit risk mitigation purposes for its affordable housing  portfolio, but has no holdings in eligible financial collateral. Hence no allowance for eligible collateral has been made in the  computation of capital charge
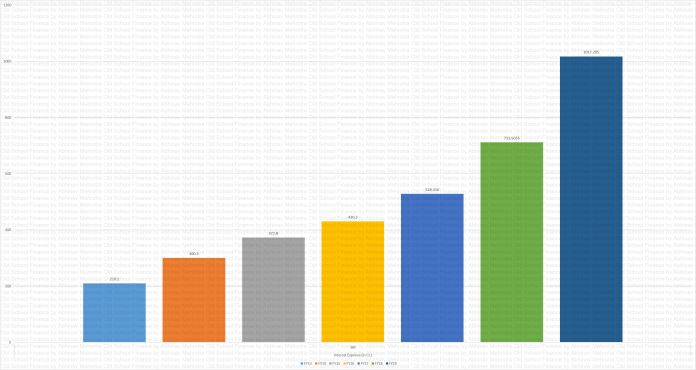
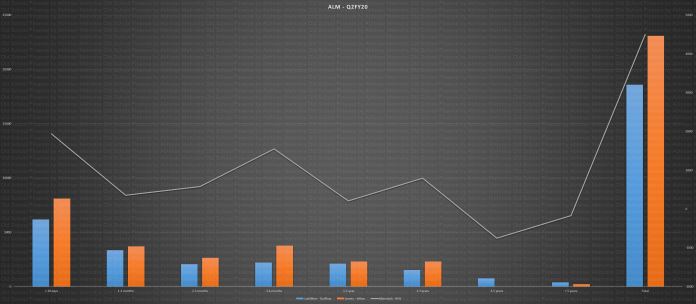
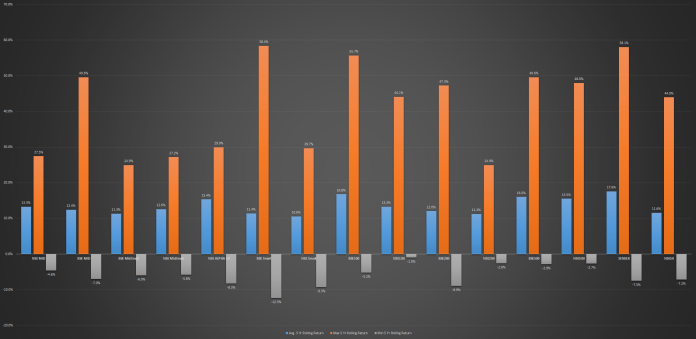
Management expects the interest rate impact to be +-12.6851 cr to earnings in case of +-200 bps move in interest rates respectively. Similarly it expects a +-27.0727 cr impact to economic value in case of +-200 bps move in interest rates respectively.
Standard

Ujjivan Small Finance Bank Annual Report FY16 Notes

This is the tenth post of the series, where I will share notes taken by me while reading the annual reports of this business. I will be sharing an excel sheet at the end of the series which will capture all the relevant data throughout the years of its operation. Notes will mostly contain intangible non-financial data which will reveal subjective characteristics of the business and management. I have restrained from adding my comments and recommendations on specific subjects as I do not want to introduce my biases in this exercise. Shorthand abbreviations are used from time to time and should be logical. For any clarification, please use the comments section. This is not a buy or sell stock recommendation, just an exercise in researching and understanding the business.
In our everyday lives, we see a lot of people and yet some we don’t. In the context of the Indian society, we normally associate poverty with the typical Indian farmer;  talk about urban migration and images of millions of educated young people leaving their homes and villages behind with the aspiration of seeking out bigger opportunities in metropolitan cities flash across our minds. However, there is also a third category of people in our society – masses of impoverished and unskilled migrants, peddlers, construction workers, dhobiwalas, housemaids, wage labourers and many such people – people who once moved to the cities with dreams and aspirations like many of us. People whose dreams remained unfulfilled because they were left behind – unseen. While most of us did not as much as notice or hear them, one particular individual did. Mr Samit Ghosh made it his dream to make millions of dreams come true. He chose to see them for what they are and that is what led to Ujjivan.
Ujjivan started operations as an NBFC in 2005 with the mission of providing a full range of financial services to the economically active poor who are not adequately served by financial institutions. Presently, Ujjivan’s operations are spread across 24 states and union territories, and 209 districts across India, making it the largest MFI in terms of geographical spread. We serve over three million active customers through 469 branches with an employee strength of 8,049. As on March’16, our Gross Loan Book stands at Rs. 5389 cr making us one of the leading providers of MF in India.
We offer a broad range of loan products to cater to the specific requirements of our customers. Our products can be classified into four broad categories, viz; Microfinance, MSE Finance, Agriculture and Animal Husbandry Finance and Housing Finance. MFI loans follow the Grameen model of lending which is a joint-liability group lending model. Depending on the end use, these broad categories of products can be further sub-divided into agricultural, education, home improvement, home purchase and livestock loans. MSE and Housing loans are both secured and unsecured higher ticket size loan products which are available for both existing and open market customers. Ujjivan has adopted an integrated approach to lending which combines a high customer touch-point typical of microfinance, with the technology infrastructure and related back-end support functions similar to that of a retail bank. This integrated approach has enabled it to manage increasing business volumes and optimize overall efficiencies. Ujjivan prides itself on being a customer-centric organization, and this is reflected in our customer retention ratio, which is 86.3%.
We have ranked consistently among the top 25 companies to work for in India by the Great Places to Work® Institute in partnership with the Economic Times. For the year 2015, we were ranked 1st in the microfinance sector by the Great Places to Work® Institute.
On October 7, 2015, Ujjivan received an in-principle approval from the RBI to set up a Small Finance Bank, placing it in a very select group of institutions to be recognized by the central bank for this institution creation. By virtue of being placed in a select group which has been granted this license, Ujjivan will transition from an institution that provided micro-credit for the unbanked and under-banked to offer a broader spectrum of products in the liabilities space such as savings, deposits and insurance, thus offering a full suite of banking products and services.
Letter from MD:
We closed the year with spectacular financial results:
• Profit after Taxes grew by 134% to `177 crores.
• Gross Loan book grew by 65% to ` 5,388.6 crore
• Our Gross Non Performing assets(GNPA) increased marginally to 0.15% of our portfolio with a cumulative repayment rate of 99.81%
• Our Cost to Income Ratio declined from 60.4% to 51% and Operating Expense Ratio declined from 8.5% to 7.5%.
• Return on Asset of 3.7% compared to 2.5% in the previous year.
• Return on Equity of 18.3 % compared to 13.7% in the previous year.
This resulted from achieving economies of scale, a higher level of efficiency and keeping credit costs at a negligible level. We moderated our Gross Loan Book growth to 65% compared 102% in the previous year. This year Ujjivan scaled new heights in financial terms as an NBFC-MFI. However, we measure our success or failure over the last ten years not just in financial numbers but also in terms of our efficient services across major stakeholders.
Customers: This year we crossed the milestone of 30 lakh customers. We acquired more than 10 lakh new customers second year in a row. Customer retention rate has remained at 86.3 %, one of the highest in the industry. This is despite the fact that we had to drop out existing customers to comply with the regulatory requirement that not more than two MFIs can lend to a customer. The high customer retention rate and the new customer acquisition were key factors in our gross loan book growing by 65% to ` 5,389 crores and is a reflection of how well customers value our relationship.
Employee: One of the unique employee benefits is the Employee Stock Option Plan (ESOP) schemes for all employees based on performance. This was instituted in 2006 and the sixth ESOP scheme was launched in 2015. Over 54% of our current employees across the organization are recipients of the ESOP. Post our IPO in April 2016, the employees could for the first time see the market value of the ESOPs they hold and this generated excitement and pride in ownership of the Company.
IPO
The immediate need to do the IPO was to meet the Reserve Bank of India’s pre-requisite that the Small Finance Bank has to be majority domestic owned. In the past, for the microfinance sector equity has been largely funded by foreign institutional investors. Our foreign ownership was in excess of 91%. Given the size of our domestic equity requirement, the only alternative was to raise it through IPO restricted only to domestic investors.
For Ujjivan the IPO has a special benefit for a majority of the employees across all segments of the organization, who are holders of ESOPs which have been issued almost since inception. A large number of these employees are our field staff and their supervisors, who are not familiar with equity markets. After this IPO the employees can exercise their ESOPs and build a ‘nest egg’ for their family.
Ujjivan is not dependent solely on large institutional investors to raise future capital and can freely access the large domestic capital markets. This will provide long-term stability in raising equity capital.
Transformation to Small Finance Bank- Moving to the platform of a specialized banking institution.
Ten years on the NBFC platform with stellar performance brings a close to one of the major chapters in Ujjivan’s history. The RBI opened up a new platform on November 27th, 2014 by issuing guidelines for Small Finance Bank (SFB).These will be specialized banking institutions to provide financial inclusion to the vast un-and under-served sections of our population and not the regular universal bank which largely serves the middle class and affluent in the retail segment and large corporates and institutions in wholesale business. This was done after considerable dialogue with the industry, largely represented by the Micro Finance Institutions Network (MFIN). I had the honour of heading MFIN as the President and worked closely with Alok Prasad who was the CEO during this crucial phase. Much to our delight, on October 7th, 2015, RBI issued an in-principle license for ten institutions of which eight were microfinance institutions including Ujjivan. This will enable us to move to a more stable and less risk-prone structure of a bank. NBFCs come under periodic threats on issues like the state money lenders acts; in general finance companies have much lower stature compared to banks among the public. NBFC-MFIs are dependent largely on a single source of expensive funding from banks and hence vulnerable, and are constantly under competitive threat for their successful line of business from banks. More importantly, the SFB will allow us to pursue our long cherished dream of being able to provide a full range of financial services and after five years of operation convert to a full-fledged mass-market bank.
The legal structure of converting Ujjivan to a holding company and setting up a banking subsidiary with the requisite capital is now in progress. After this is completed and along with a number of other requirements like bank board members, branch opening plan, independent certification of the IT infrastructure etc., we would be applying for the final license.
Meanwhile, the transformation work on the business front is continuing in full force and had commenced before the in-principle license was issued. Ernst & Young was appointed as the consultants for the overall project. On the technology front, key additions to the current infrastructure are in progress. We are in the process of implementing the Finacle core banking and treasury systems from Infosys; CRM solution from CRM-Next; mobility solutions from I-Exceed; comprehensive risk management system from SAS; upgrading the Human Resource module from RAMCO; Oracle Accounting System, hardware from Oracle, CISCO etc.; Wipro has been engaged as the System Integrator.
Competence mapping of existing staff for various positions in the SFB has also been undertaken. Training programs are proposed to be held during the six months prior to the launch. IT training has already commenced. Along with this, we have started a ‘mindset change’ training for existing staff from a loan giving institution to that of an institution which will provide a full range of services including savings.
We plan to consolidate our existing branches and convert them to full-service SFB branches. We will open the required number of new Unbanked Rural Branches (URB) over the year as per the SFB guideline requirement.
In order to provide the customers multiple channels/access points, we will supplement the branches with alternate delivery vehicles like ATMs, phone banking, banking correspondents and also internet banking. This is also being planned to be executed in a phased manner. • On the product side, we have undertaken considerable research on the savings habits, likes and dislikes of the target market customers. We are designing the products and services accordingly. In addition, we are working on remittances and third-party insurance products which will be launched in a phased manner. We are also enhancing our loan products for the SME sector.
The Future
We expect to launch Ujjivan Small Finance Bank in a phased manner in the first calendar quarter of 2017. We expect the first 12-18 months to be a stabilization period for the bank to ensure all systems and processes work smoothly and we do a phased expansion of distribution, channels and products. We expect to start on an accelerated growth after this stabilization period. In five years from the date, we start the Ujjivan Small Finance Bank, we will work towards converting it to a full-fledged mass-market bank.
The financial inclusion space has moved very steadily post the Andhra crisis in 2010. However, this is now going to be totally disrupted with major developments which will accelerate the whole process of financial inclusion:
• Entry of eight aspiring Payment Banks especially those with the wide distribution network and mobile technology of TELCOs joint ventures. They will compete hard for the payment and deposit business. However, the viability of this business will depend on creative solutions and add-ons. The wallet business though currently attractive for those who are un-banked will come under serious threat with the new mobile payment systems being developed by NPCI.
• The ten Small Finance Banks who are still in the running will bring about change by providing a wide range of services, each following their DNA. However, the success of the SFBs will depend on the scale and how well they are able to widen the net to include the un- and underserved.
• On the liability side with the extensive seeding of the Aadhar biometric identification system, NPCI’s payment systems and with the reach of mobile technology, as Nandan Nilkeni points out, the portability of savings accounts and balances will increase dramatically using mobiles. This will have a massive disruptive effect which early adopters can take advantage of.
• In India e-commerce has taken off. This allows a large number of Micro, Small and Medium-sized Business Enterprises to sell their goods and services using these platforms. This will generate a wealth of data for future funding institutions and who can use analytics to extend credit. Already fintech companies are trying to capture this business. This will be a huge opportunity on the asset side of the business. Revisit this statement in a few years.
These are some of the major changes which will disrupt the whole financial inclusion space in the next five years thus changing the entire landscape. The winners will be those who remain at the cutting edge and scale their business.
For the first time in Ujjivan’s history, Ujjivan conducted mass-marketing activities throughout the country like wall branding, auto rickshaw branding as well as van campaigns. This new initiative gained Ujjivan a lot of attention resulting in an increased brand and product awareness throughout the country. A significant number of leads were successfully generated providing fresh opportunities for new customer acquisitions.
Micro and Small Enterprise (MSE) Finance
The MSME sector is a major contributor to the GDP and the Government of India has launched a  number of programs to accelerate the growth of the sector. As per reports published by the ministry of  SME and  International Finance Corporation, the bulk of the sector is Micro and Small Enterprises (MSE), the majority of which are unregistered. The MSEs face a lot of issues in accessing institutional finance and continue to be dependent on sources such as moneylenders, pawnbrokers, chits/committees apart from family and friends. It has been acknowledged that lack of institutional finance has stunted the growth of MSE for decades. Therefore, the Reserve Bank of India has mandated the aspirants of Small Finance Bank to focus on MSE as one of the main customer segments.
Additionally,  Government of India has set up a dedicated refinancing agency MUDRA (Micro Units Development and Refinance Agency  Limited.) to facilitate the flow of funds to this segment of customers. The unmet financial needs of MSEs offer a great opportunity for banks and NBFCs to develop a  strong business line dedicated to the sector. However, the banks have not been able to do much due to various structural issues and NBFCs have not been able to provide a complete product suite, apart from term loans. Ujjivan has recognized MSE as its main target segment in line with its mission and also for product diversification and future growth. As a part of its Individual Lending (IL) Program, Ujjivan has financed over 1,10,000  micro enterprises and disbursed approximately ` 660 crores since the program was launched. This was achieved by graduating the eligible customers from Group Lending Program (GL) as well as by inducting new customers from the open market. In last two years, our focus on the open market has increased.
The way forward
Screenshot 2018-04-06 14.13.48.png
A dedicated MSE finance unit has been set up to cater to the needs of the segment. The unit will understand the needs of the customers, the business environment including competition and the risks and mitigations in order to bring out products and services for the micro and small enterprises. The products and services are being kept simple with high technology support in order to ensure fast delivery, quality underwriting and superior customer experience while maintaining efficiency.
The following products will be on offer:
For Unregistered Businesses (mostly micro enterprises):
• Unsecured Business Loan
• Secured Business Loan
For Registered Enterprises (mostly small enterprises):
• Unsecured Enterprise Loan
• Secured Enterprise Loan
• Secured Overdraft
Additionally, the facilities of Current Account, Remittance and Payments, Insurance, Savings and  Investment will be offered (by Ujjivan as an SFB) to the people who are running the MSEs and employed in it. So will they target the employees of the organization they will serve to open savings a/c?
The use of technology will be instrumental in delivering superior customer experience by bringing efficiency in origination and management of loans. Further, technology will increase the reach and profitability of the MSE business vertical by making available reports and MIS. Better customer segmentation, predictive analysis to facilitate target marketing; and credit decision as well as portfolio management will also become possible. MSE Finance will be Ujjivan’s growth engine during the current year and also in the years to come.
Housing Finance
In the year 2012, Ujjivan realized its customers need for housing finance assistance and introduced  Housing Microfinance with a loan amount up to `1,50,000 being offered outside the group loan scheme, through an unsecured lending program.
This amount was not enough to meet larger needs of the customers and the segment that  Ujjivan caters to. To address this, Ujjivan introduced the higher ticket size Secured Home loan product last year to help customers meet their financial assistance for large repair work, construction or purchase of a house.  The lower income segment has been plagued by informal titles, unorganized construction, fluctuating income,  lack of basic technical knowledge on construction and rising cost of raw materials. But despite all the challenges at hand, a strong foundation has been laid in the housing segment since the launch of Secured Home  Loan. The product has been customized as per the segment’s need without disturbing the risk parameters’  fabric. How?
Target Segment • Age: 21-65 years • Monthly Household Income: ` 8,000 –` 50,000 • Occupation: Salaried/Self-employed in formal/informal segment
The number of borrowers is well spread across 4 different repayment windows (weeks) of the month as per their choice, easing caseloads for staff in repayment collections and customer servicing. 28% of borrowers make their repayments during the first week of each month, 35% in the second week, 30% in the 3rd week and 7% in  4th week respectively.
Technology Roadmap for Future Small Finance Bank
Ujjivan Financial Services Limited took another decisive step towards its proposed small finance banking operations by earmarking more than ` 300 crores, to be invested for implementing and integrating its Core Banking Technology for over the next five years.
The best of the breed technology solutions providers for its upcoming bank IT infrastructure includes Finacle Core Banking from Infosys, CRM Solution from CRMNext, Mobile Unified Platform from i-Exceed, Sysarc Loan Origination System, ADF from Pragmatics, SAS complete suite for AML, ALM FTP and Risk and Governance, Ramco HRMS, Oracle Financials, Oracle Hyperion, IBM Cognos for DW and BI, IBM FileNet for Document Management and Workflow systems, IBM Middleware and IBM Enterprise Service Bus to integrate all systems together. All these systems will be in addition to the existing systems which includes BR.net and mobility solutions like Artoo and Truecell. Core Banking and all other systems will run on most secure and robust servers like Oracle Sun SuperCluster, CISCO Blade Servers and Cisco Routers and Switches. More than 125 strong IT professionals will be managing the technology department for the upcoming bank.
Ujjivan will be focusing highly on mobility solutions and will implement mobile technology using mobiles and handheld devices to reach the rural customers. Even today Ujjivan is using the latest mobile technology for customer acquisition, customer support and collection management for its current MFI business. Keeping in mind the need for high security and top of the line disaster management, all IT infrastructure will be hosted in IBM Data Centre at Mumbai and the Disaster Recovery Data Centre will be hosted in Airtel Data Centre at Bangalore. Ujjivan will also be hosting a 3-way Data Centre DC, DR and NDR (Near Disaster Recovery). Ujjivan’s strong management team, with an equally strong consultancy team from EY and good connection with technology partners which includes names like IBM, Oracle, Cisco, SAS, Microsoft, EMC, Craft Silicon and Artoo will support the company to set up a strong technology-driven bank for the future.
“ Unlike other organizations, Ujjivan made it a point to provide ESOP even to the resigned employees who had options vested with them, that in itself speaks a lot about the best policies of the organization. I feel happy  that I was a part of the organization in the past.” (Awneet Choudhary, South) – Ex-employee.
MD&A
Productivity: FY2015-16 saw an all-around improvement in branch and field staff productivity.  Borrower per CRS improved to 761 from 568 in March 2015. Gross loan book per branch increased to 11.5 crores from  7.7 crores. Average GL TAT improved from 5.78 days to 4.32 days while average IL TAT improved from 6.45 days to 6.27  days
Credit Quality: Portfolio quality held up well with PAR at >0.27% in March 2016 against 0.18% in  March 2015. There was an increase in the overall PAR on account of sporadic incidents of over-borrowing in some geographies across the country (MP, Orissa, and Maharashtra), the massive growth of IL portfolio and increased proportion of death cases.
Screenshot 2018-04-06 15.40.48.png
Loan Book Drivers
Akarshan loans, a higher ticket offering targeted at attracting new customers with good credit history from other institutions, was instrumental in acquiring new customers in highly competitive areas. Additionally, expanded working area for increased penetration and rewards and recognition programs were the key enablers for the increase in new customer acquisitions in mature branches. We added 12 lakh, new customers, crossing the 10 lakh mark for the second consecutive year. Our commitment to quality customer service, better  customer connect, reducing loan turn-around time and wait time at the branch for disbursement ensured good persistency  and healthy repeat conversions
Our second year of the loyalty program, a limited period offering specially designed for existing customers with good credit track record to enable micro trade facilitation during the festive season, successfully added `  445 crores of business.
Our core GL business contributing 87% of our Gross Loan Book grew 60% over that in the previous year. We launched a new product called Agriculture and allied loan to meet loan requirements for activities such as crop cultivation, purchase of small equipment and animal husbandry etc. for the marginal and tenant farmers under  Group Lending. We raised the ticket sizes of the loans going up to ` 30,000 allowing the customer an option to repay in 1 or 2 years depending on her repayment capacity in line with revised RBI regulations.
Taking off on the big leap last year, our Individual lending Business registered a collective growth of  102% constituting 13% of our Gross Loan Book. This year, we looked beyond converting the captive eligible pool of higher vintage group loan customers and focused on open market business to expand our outreach and ramp up our volumes. The open market business contributed to 22% of our overall volumes this year compared to 10% last year while GL to  IL conversion contributed to 60% of our overall volumes this year compared to 75% last year. Focus on process efficiencies, reduced loan service time and product level initiatives ensured better persistency. Repeat IL Business contributed to 18% of overall volumes compared to 15% last year. Our client outreach increased from 71 thousand active borrowers in March 2015 to 151 thousand active borrowers in March 2016. Our Individual Lending Business is operational in 374 branches. The offering was rolled out in 69 additional branches during the year.
Our Secured Housing Finance Business, piloted in January 2015 gathered momentum, amassing a  portfolio of ` 21 crores with 703 active borrowers across 109 branches. Another product innovation launched this year was the introduction of Priority Sector Lending (PSL)  compliant variant of Individual loans – Pragati Loans with lower interest rates and simplified procedures. The Product contributed a third of overall volumes and Individual Lending borrower base.
Our marketing initiatives helped create better brand and product awareness while fostering stronger customer connect. Our evangelical marketing initiatives at over 100 locations saw the participation of thousands of customers. The evangelical campaigns celebrated the success stories of existing customers and shared them with potential customers.
Others include Agri, Animal Husbandry and Higher Education Loans. Livestock loan is the key component of the segment, constituting 90% of the portfolio. The livestock loans grew by 163% over last year to close at a Gross Loan Book of ` 153 crores. Higher Education Loans and Agri Loans are seasonal in nature and were both piloted in FY2014-15. Agri-Business grew from 2 crores in March 2015 to ` 8.5 crores of the portfolio while the Higher Education  loans grew 151% over last year to close with a gross portfolio of ` 7.7 crore
Improving Productivity
A key focus area for this year was the improvement of branch and field staff productivity. Enhanced targets were set to raise the bar on performances of our matured branches. We stopped adding more than 8 field staff for branches handling less than ` 10 crores of the portfolio. A key initiative this year was the extension of the repayment window from 3 weeks to 4 weeks, easing caseloads for staff in repayment collections and customer servicing. Our Borrowers/CRS increased to 761 in March 2016 against 568 in March 2015 while our Gross  Loan Book/Branch increased to 11.5 crores per branch in March 2016 from 7.7 crores in March 2015.
Our continued focus on cashless disbursements has helped us build efficiency. 61% of our total disbursements (in terms of monetary value) were effected through the cashless route. 16.65lakh loans were disbursed to the bank accounts of the customers compared to 9.76lakh last year, a 71%  growth. Our Average GL TAT improved from 5.78 days to 4.32 days while average IL TAT improved from 6.45 days to 6.27  days. Our Fresh Loan TAT is at 7.02 days, 63% of the loans are disbursed under 7 days.
Independent Credit function is unique to Ujjivan. We have a strong team of over 400 spread across operating geographies, giving us real-time insights on the portfolio. It is responsible for developing credit policies, monitoring portfolio quality and driving collection initiatives to ensure healthy portfolio growth. Group lending business is supported with centralized credit decisions, it reviews every application independently along with bureau reports and ensures adherence to internal credit policies and guidelines. In case of Individual  Loans, an independent credit check on field forms an integral part of the loan underwriting process.
The stellar portfolio performance is an outcome of the sound Credit Policy Framework and robust Loan underwriting process at Ujjivan. This has not only helped us acquire quality customers but also maintain a healthy portfolio quality. As we continue to scale up our Individual Lending business, we plan to adopt a customized Credit Application Score to further enhance our loan decision process. We also took another significant step towards prudent risk management by introducing a Branch Risk Scorecard. The scorecard jointly developed by Credit, Audit and Vigilance aims to monitor, manage and mitigate internal and external risks proactively. This scorecard also helps in integrating all elements of risk and provides a comprehensive view of branch risk. In its pursuit of process advancements, Ujjivan has embarked on various key projects.  Ujjivan was the first in the MFI industry to be on-boarded by UIDAI as an Authorized User Agency (AUA) and KYC User  Agency (KUA). This will allow us to undertake E-KYC authentication for Aadhar IDs submitted by our customers in real-time, thus helping us to improve our efficiencies and prevent identity frauds. We are also one of the first in the MFI industry to automate collection process through the Collection Software. This will make overdue collection processes and related activities real-time and system-driven, thus allowing better and timely operational control. Other key technological development envisaged is the implementation of Business Rule Engine that will automate the credit check and credit decision process.
Operational Risk
High staff turnover and Cash Handling risk remain critical influencing factors in this service industry.  Ujjivan has successfully contained attrition at 18.4% with several employee engagement and retention initiatives. To minimize cash handling risk, we have focused on cashless disbursements and cashless collections. This year 61% of our disbursements were effected through the cashless route, and 38% of our the collection proceeds were channelized for cashless disbursements. 92% of the high risk centres in Bihar and Jharkhand and UP have been secured through customer carrying repayment to the branch to minimize cash handling risk. 56 branches have been brought under CCTV surveillance and Safe vault grouting (strong room alternate) have been completed at 30 high-risk branches. Fraud Containment Unit (FCU) has been set up in all regions from July’15.
Sector Outlook
The sector reported significant growth in the last year with 65% growth in disbursements, 84%  growth in portfolio and 44% growth in client base, reflecting all-round growth and momentum in the sector. The NBFC-MFI Guidelines released in April 2015 by RBI allowed an increase in the permitted limit of indebtedness from ` 50 thousand to ` 100 thousand, relaxation in income generating assets norms from 70% to 50%.  The RBI increased the maximum borrowing limit from MFIs to ` 60 thousand in the first disbursement cycle and ` 100  thousand in consecutive cycles (compared with ` 35 thousand and ` 50 thousand earlier). The RBI also increased the cap on the borrowers’ maximum household income to ` 120 thousand in rural areas and ` 160 thousand in urban areas  (vis-à-vis) ` 60 thousand and ` 120 thousand respectively, earlier).
Further, the RBI Notifications of Nov 2015 allowed an increase in maximum loan amount for a tenor less than 24 months to ` 30 thousand from ` 15 thousand. The revised regulations will open up avenues for product innovation, expand customer base and keep demand for Microfinance loans high as lending rates reduce in line with reducing borrowing costs by MFIs.
Financial inclusion efforts received a big fillip with the launch of the PMJDY and Micro Units  Development and Refinance Agency (MUDRA). The setting up of MUDRA has been a positive step for the MFIs. It is believed that, MUDRA will be able to provide funds at 100-300 basis points cheaper than bank funding. This will pull down MFIs’ cost of funds depending on the extent of MUDRA funding. MFI borrowers will also benefit as a result.
The eight MFIs cumulatively accounted for about 26% of assets managed by the industry as of  2014-15. As they exit the industry, after metamorphosing into SFBs along with Bandhan (which converted into a universal bank and accounted for 20% of March 2015 Gross Loan Book), the MFI industry size will halve.
Transitioning into an SFB will allow the MFIs to reduce their dependence on bank borrowings and provide them with access to a wider range of funds, including savings products and diversified base of customer deposits. The additional funding sources will enable SFBs to broaden their funding sources and access funds at a lower cost,  thereby enabling them to offer loans at competitive rates. Multiple licenses granted to payment banks, SFBs and other universal banks may enhance the threat of competition.
The transition will entail massive investment in branch up-gradation, branch infrastructure, technology and processes, the hiring of people with expertise and upscaling the existing staff which will depress the margins of the new SFBs in the short term. The biggest challenge will be quickly garnering a strong retail liability base and growing the loan book in the face of stiff competition from other SFBs and existing commercial banks.
Mr Samit Ghosh finally is not part of the remuneration committee from this year.
Won the 3rd best place to work in India for 2016.
Standard